Land Use Land Cover
EO Capability Benefits
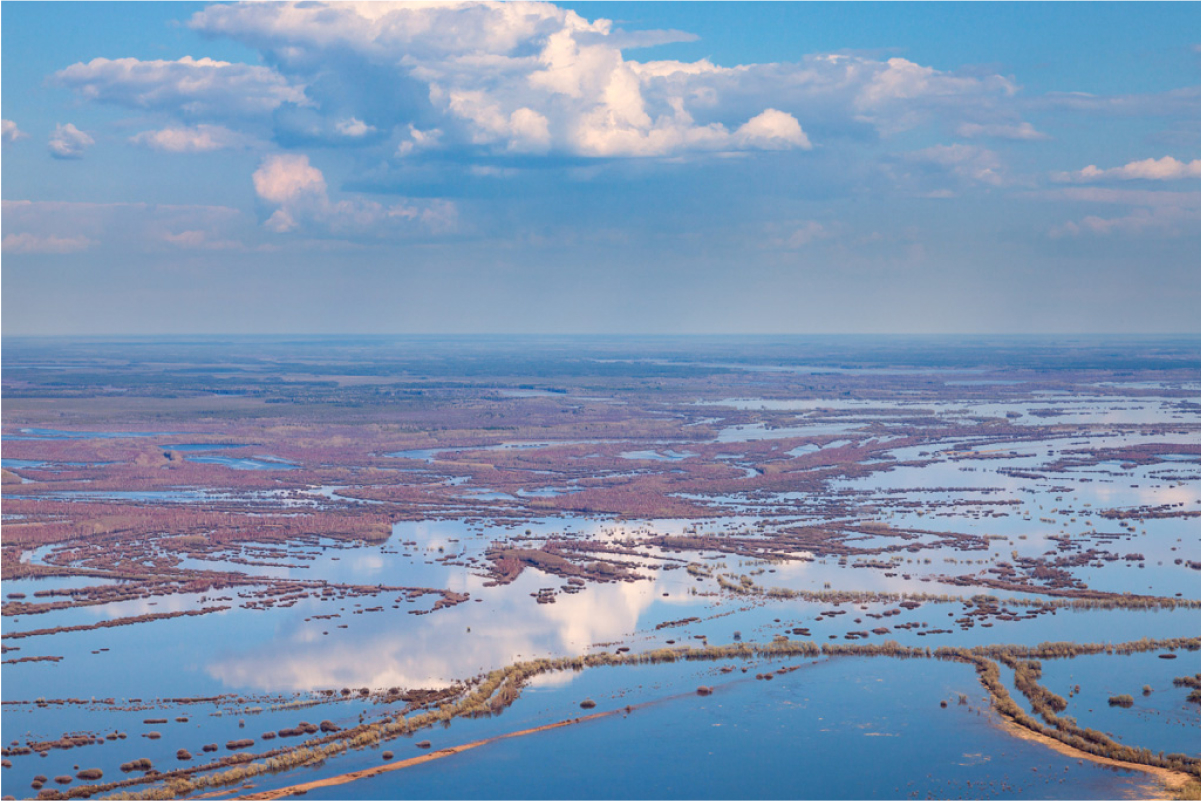
Changes in land use and land cover (LULC) can have significant impacts on biodiversity loss, water resource degradation, and carbon storage. As global warming intensifies, land cover is changing faster than ever in many parts of the world, heightening the need for rigorous monitoring. Monitoring changes in LULC is essential for a wide range of applications, including urban planning, disaster risk reduction, conflict monitoring, water resource and ecosystem management, as well as promoting clean energy initiatives to mitigate climate change. Earth Observation (EO) data shows how land use is influenced by human activities and extreme weather events.
EO Capability Description
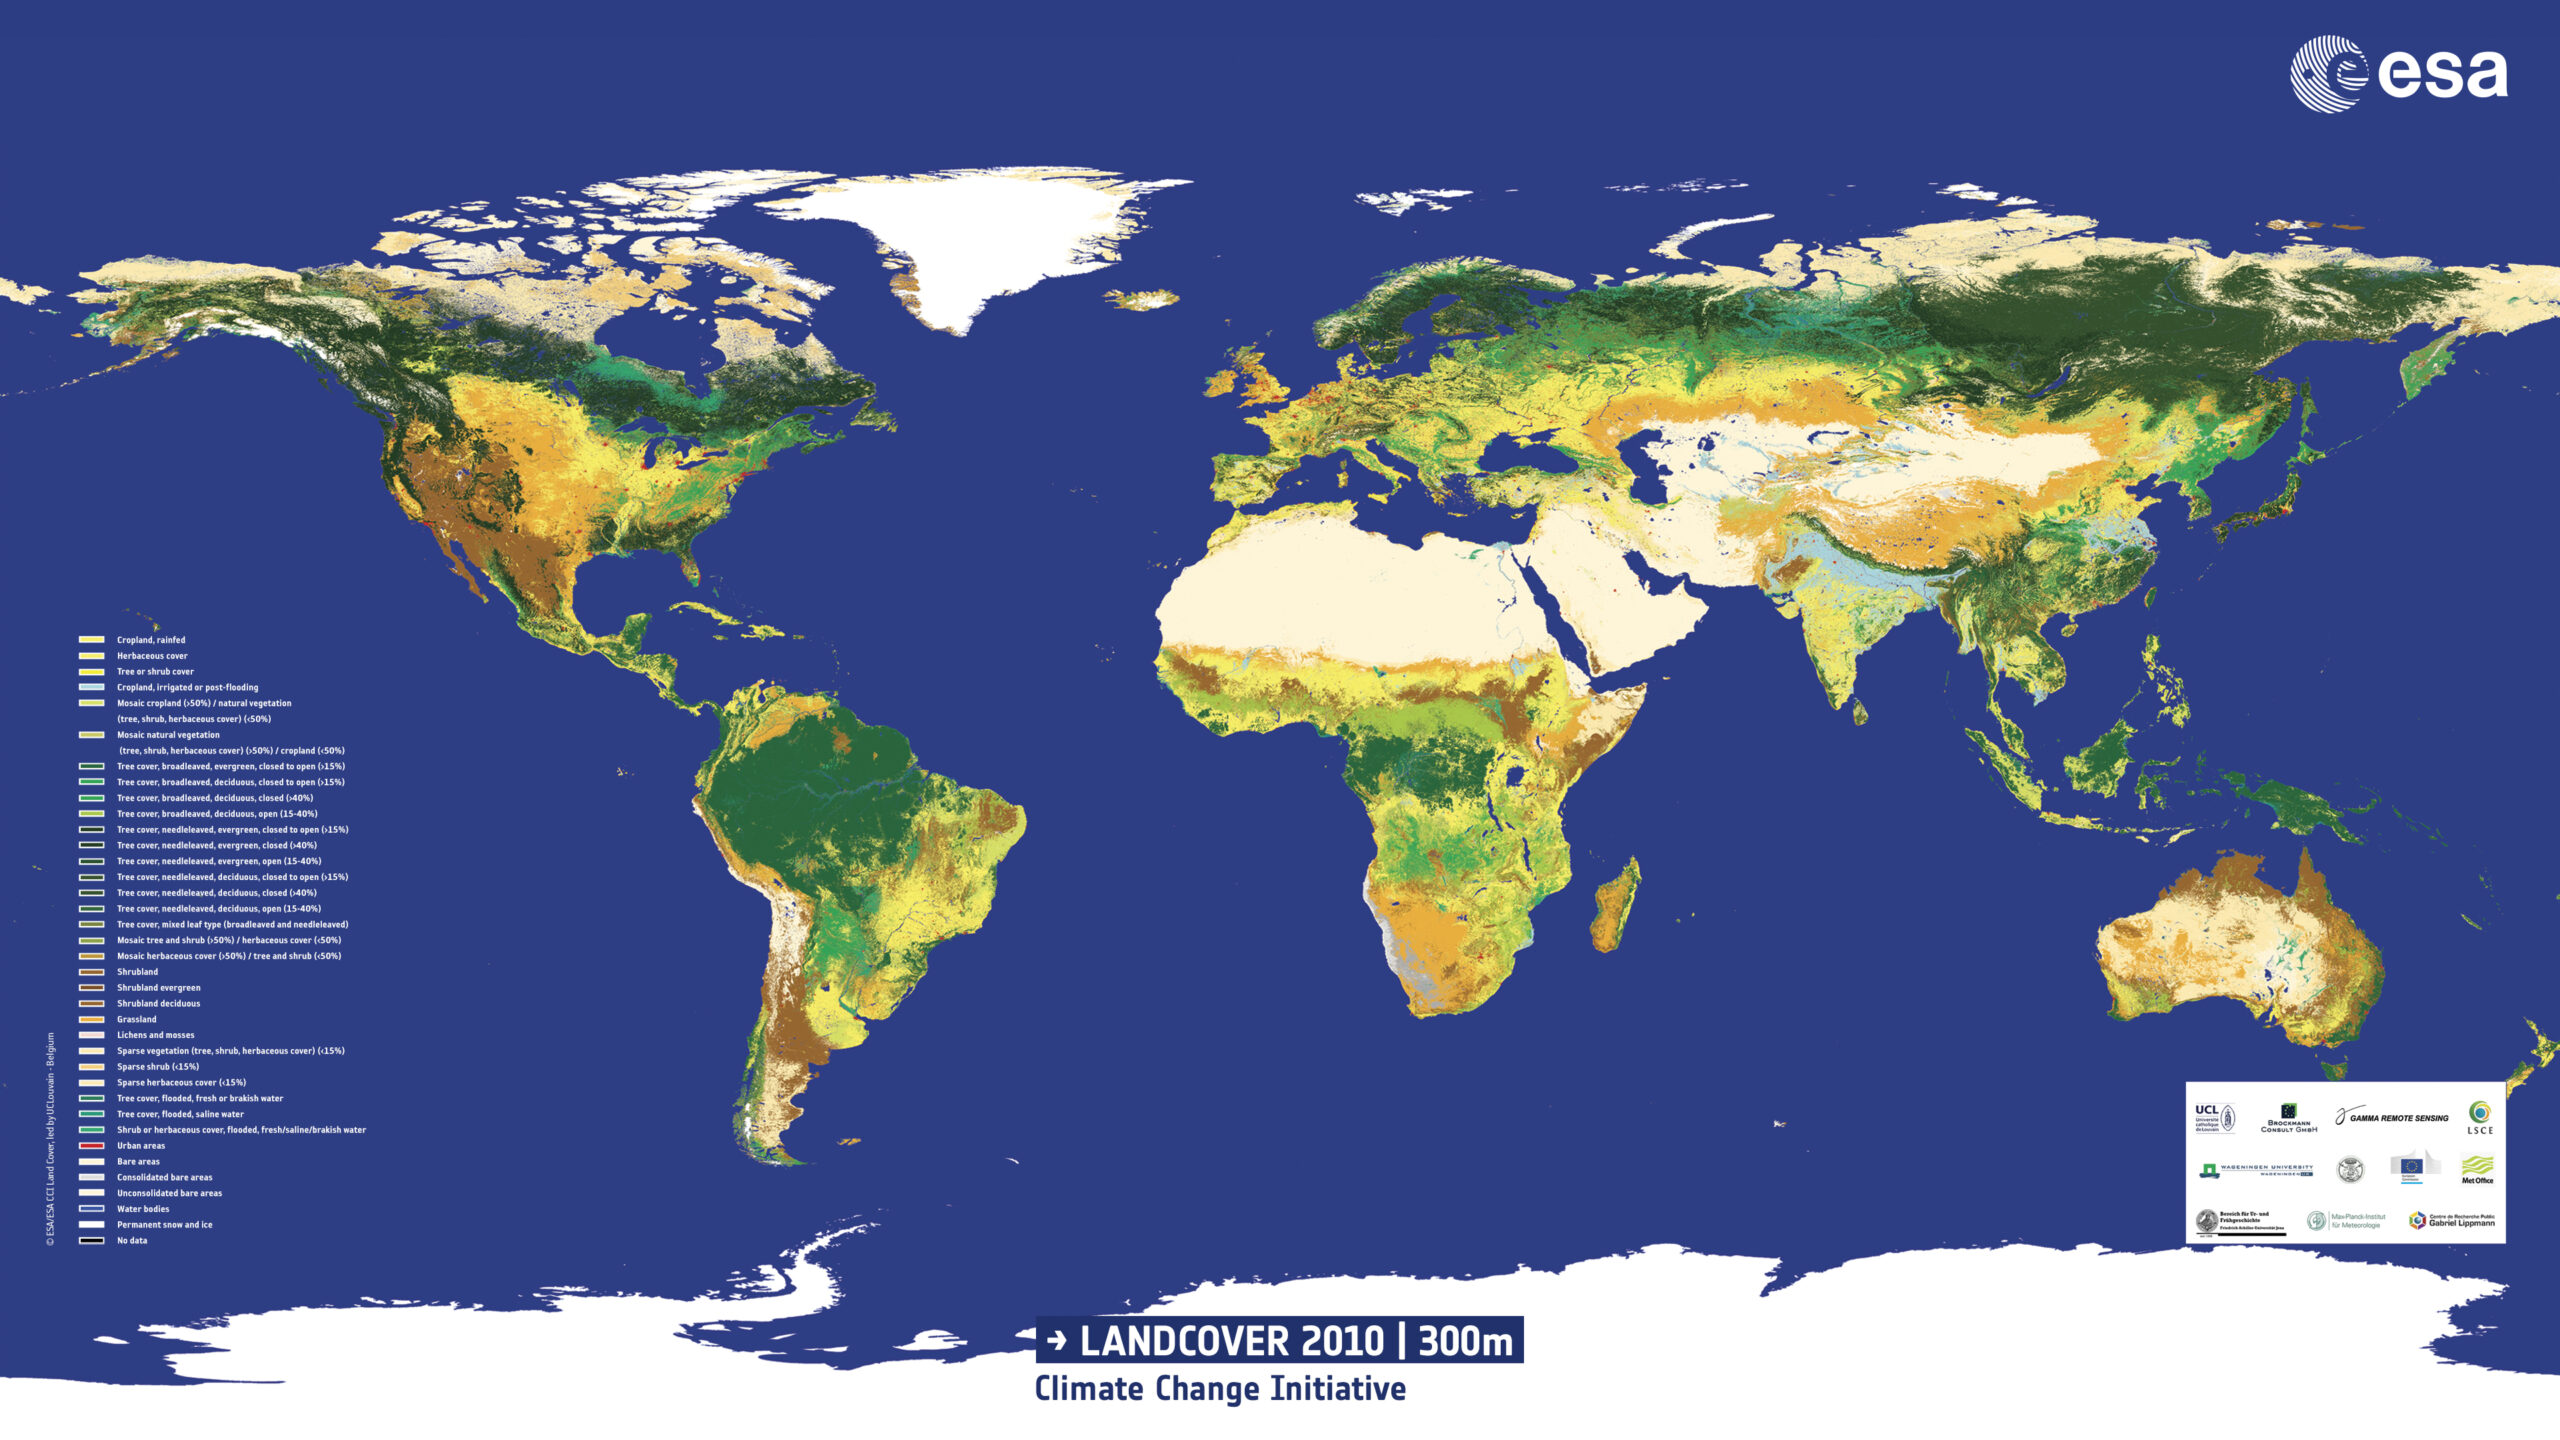
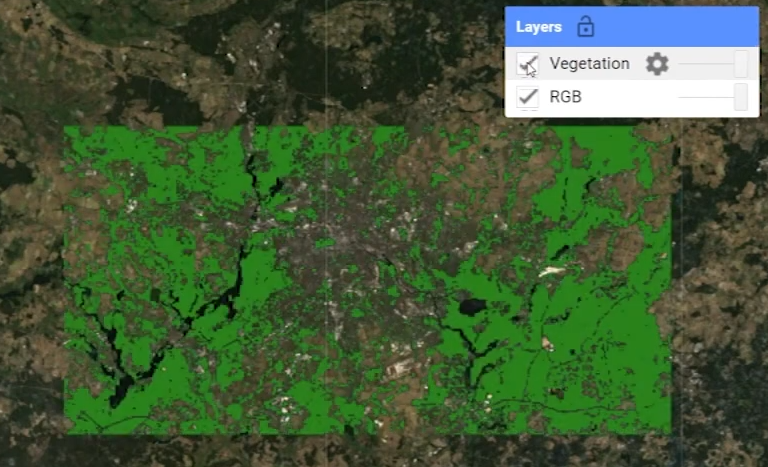
With satellite-based observations becoming increasingly precise and available at higher resolutions, land use land cover changes can be monitored continuously and at finer scales. At the global scale, annual land use land cover maps are essential for quantifying carbon emissions and sequestration by tracking changes in deforestation, reforestation, and agricultural expansion. These maps can also monitor shifts in agricultural zones. Global LULC products, such as those developed by ESA’s Climate Change Initiative (CCI), are now available at 10m resolution. Land cover classes typically follow established nomenclatures with varying levels of detail. Besides the spatial resolution, users should also take note of the thematic accuracy which can vary significantly between classes. All high quality LULC products should include a report detailing the validation methods and results.
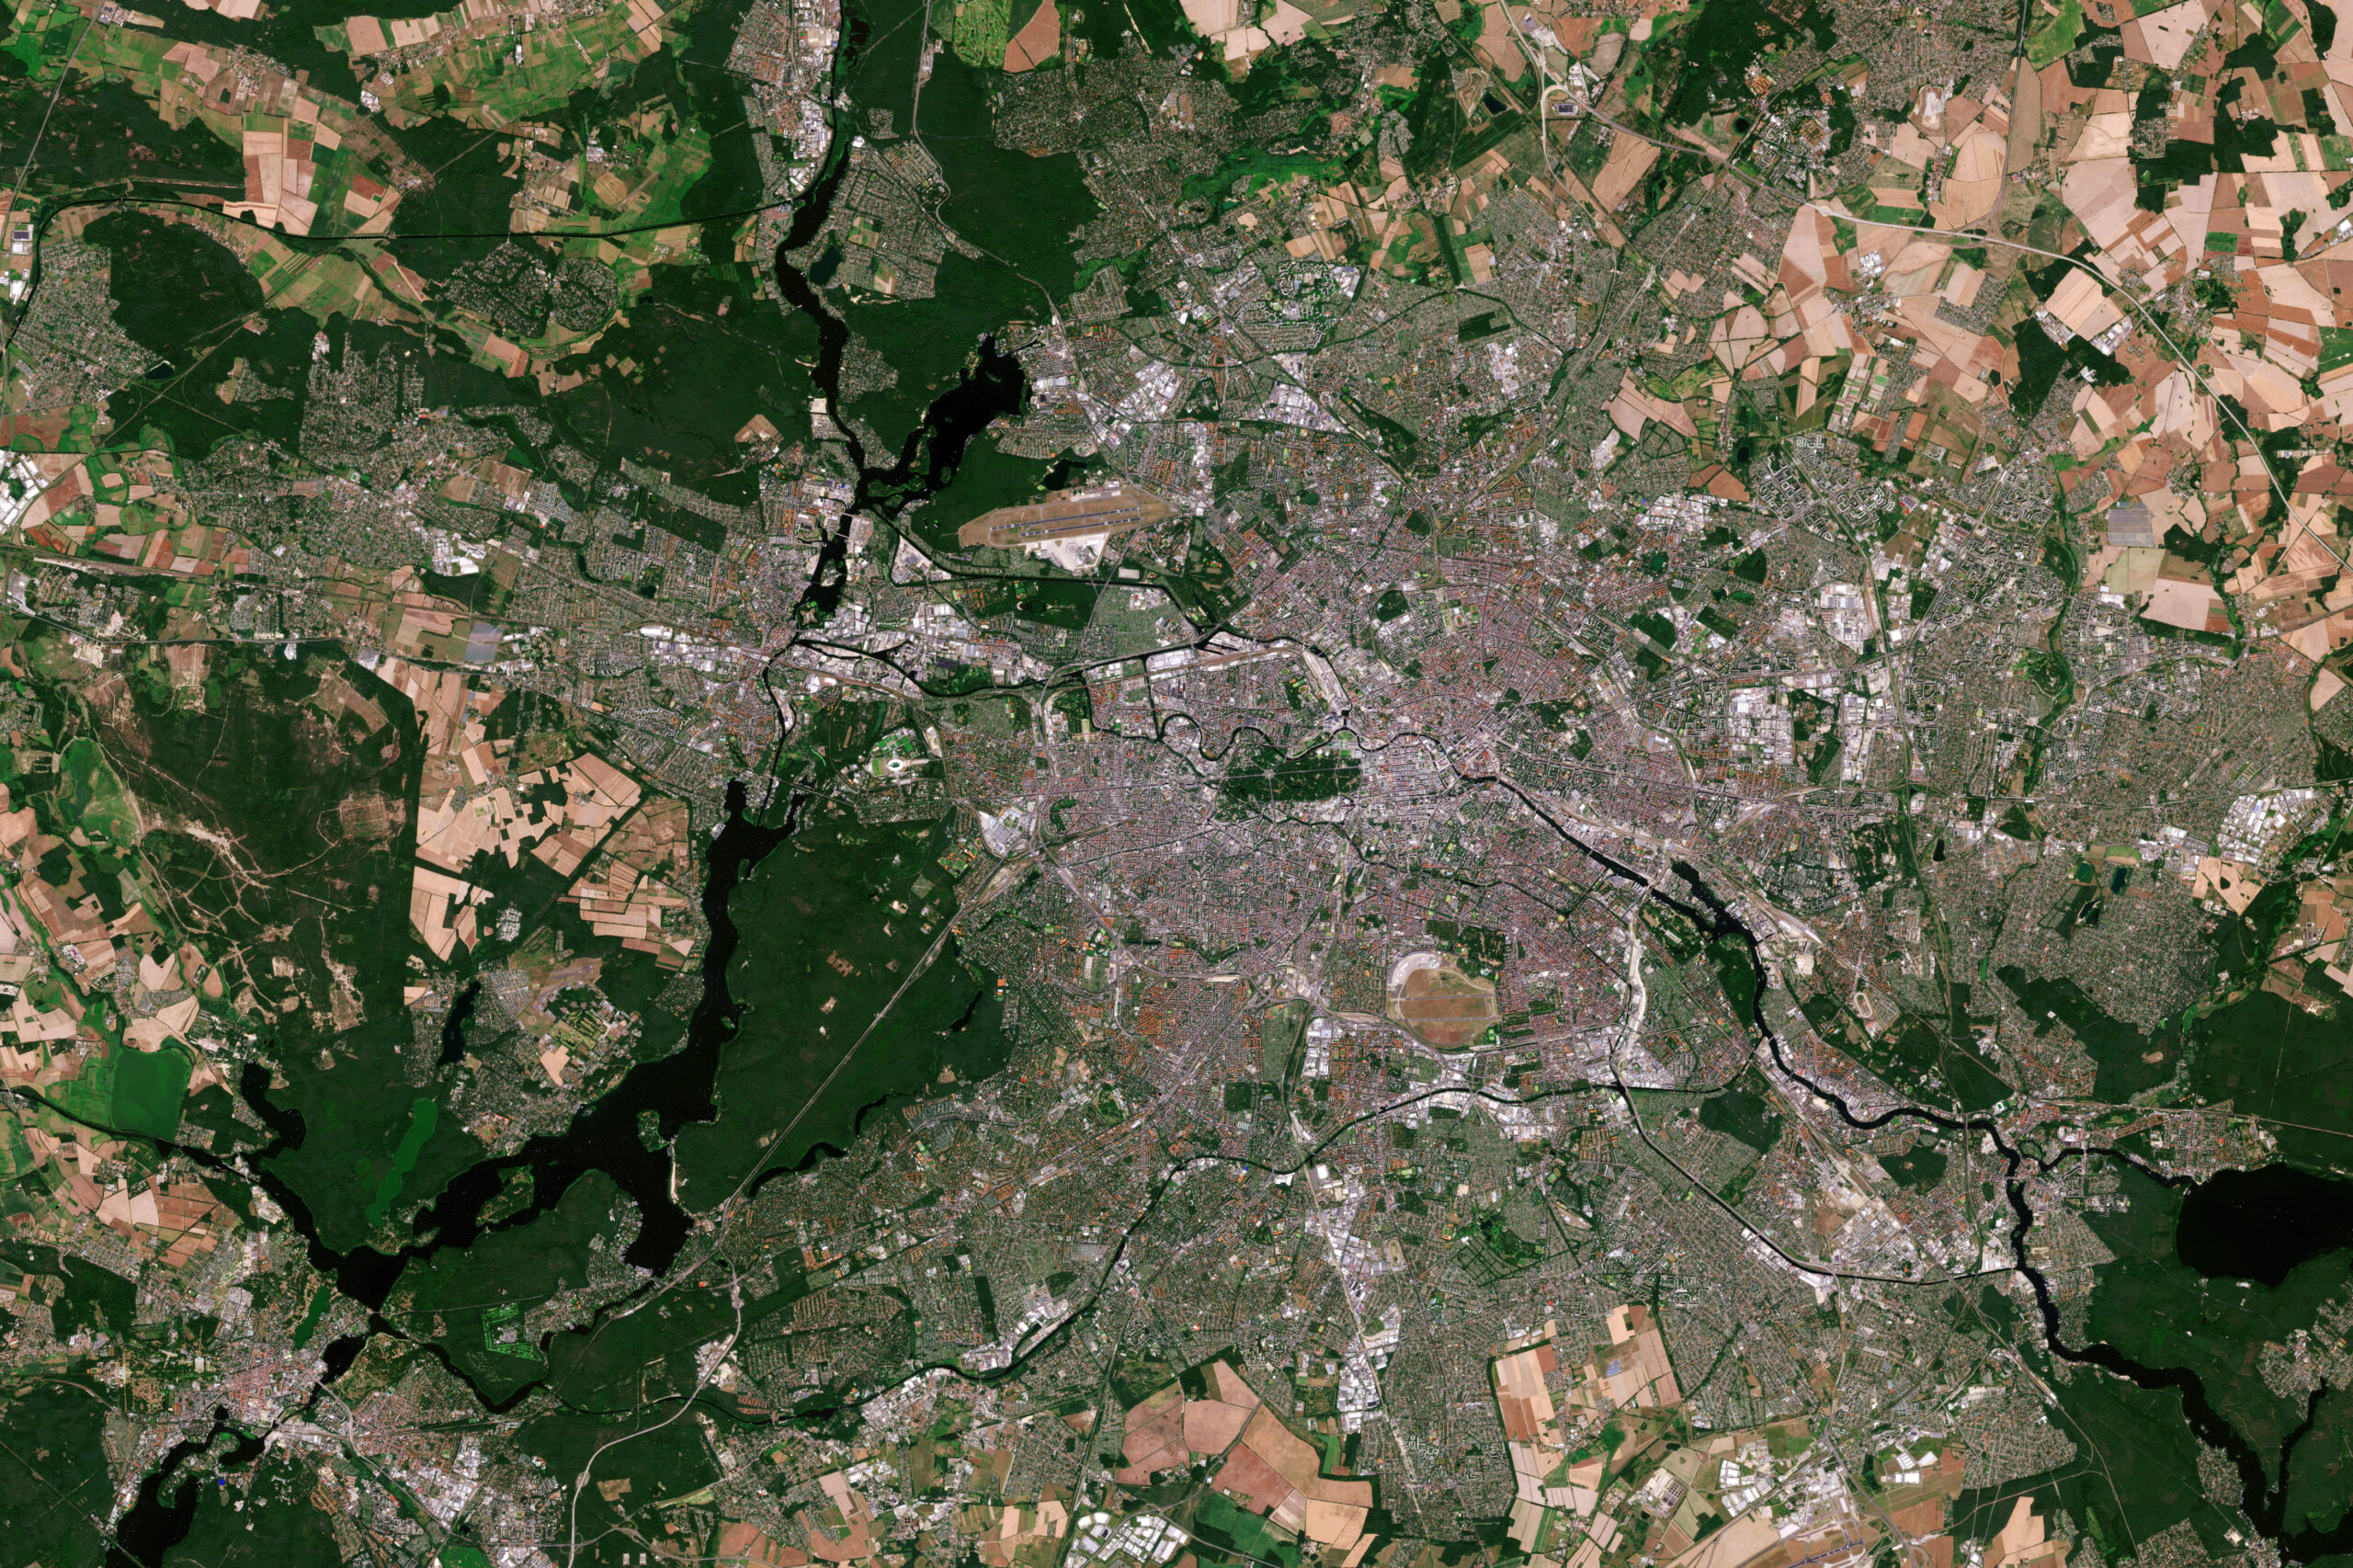
LULC maps serve as foundational input layers for other products and applications, enabling comprehensive analysis. Multitemporal LULC data provides valuable insights into land cover changes over time, highlighting trends and transformations. These products can achieve spatial resolutions as high as 0.5m, though lower resolutions of 10m–30m are usually sufficient for larger-scale applications.
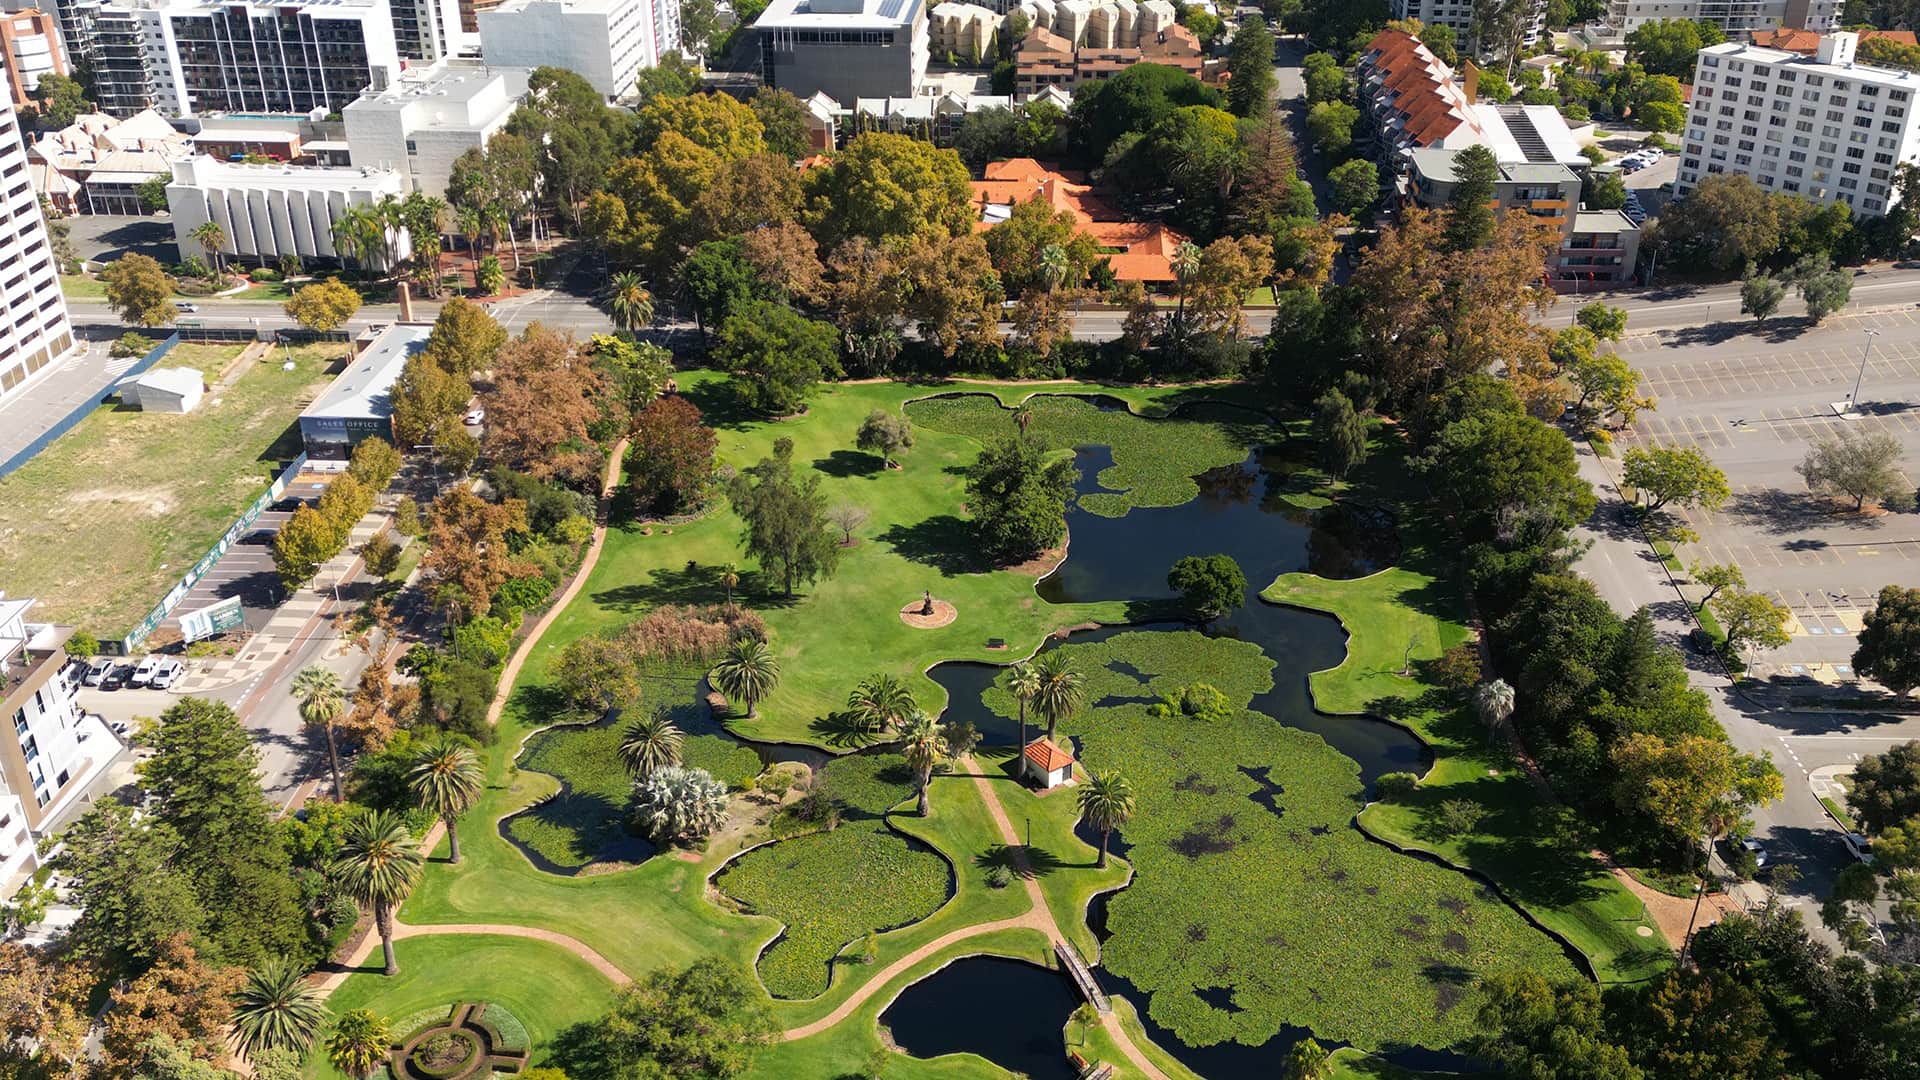
LULC products often include 15, 20, or even 30 different classes. On maps, these classes may be represented by colours that are difficult to distinguish, as humans can only effectively differentiate and attribute 10 colours, at most. First-time users who may find city-scale LULC maps overwhelming should note that these products are typically intended to serve as inputs for further analysis, often at larger scales, allowing for more manageable interpretation of land use and land cover dynamics. Many classes associated with actual land use (such as “commercial”) require secondary non-EO data (such as statutory development plans or OpenStreetMap) to be deduced.
Indicative Cost Range Details
A number of free and open land cover datasets are available. Examples include ESA’s 10m 11-class WorldCover product or the 9-class 10m product by Impact Observatory. On-demand commercial products start at around 2.00 EUR/km² depending on various factors including the number of classes and update frequency. Quality assurance indicators such as thematic accuracy along with the methodology followed should always be requested as well.
Indicative Cost Range
Free or from ~2.00 EUR/km²