Vegetation Indices
EO Capability Benefits
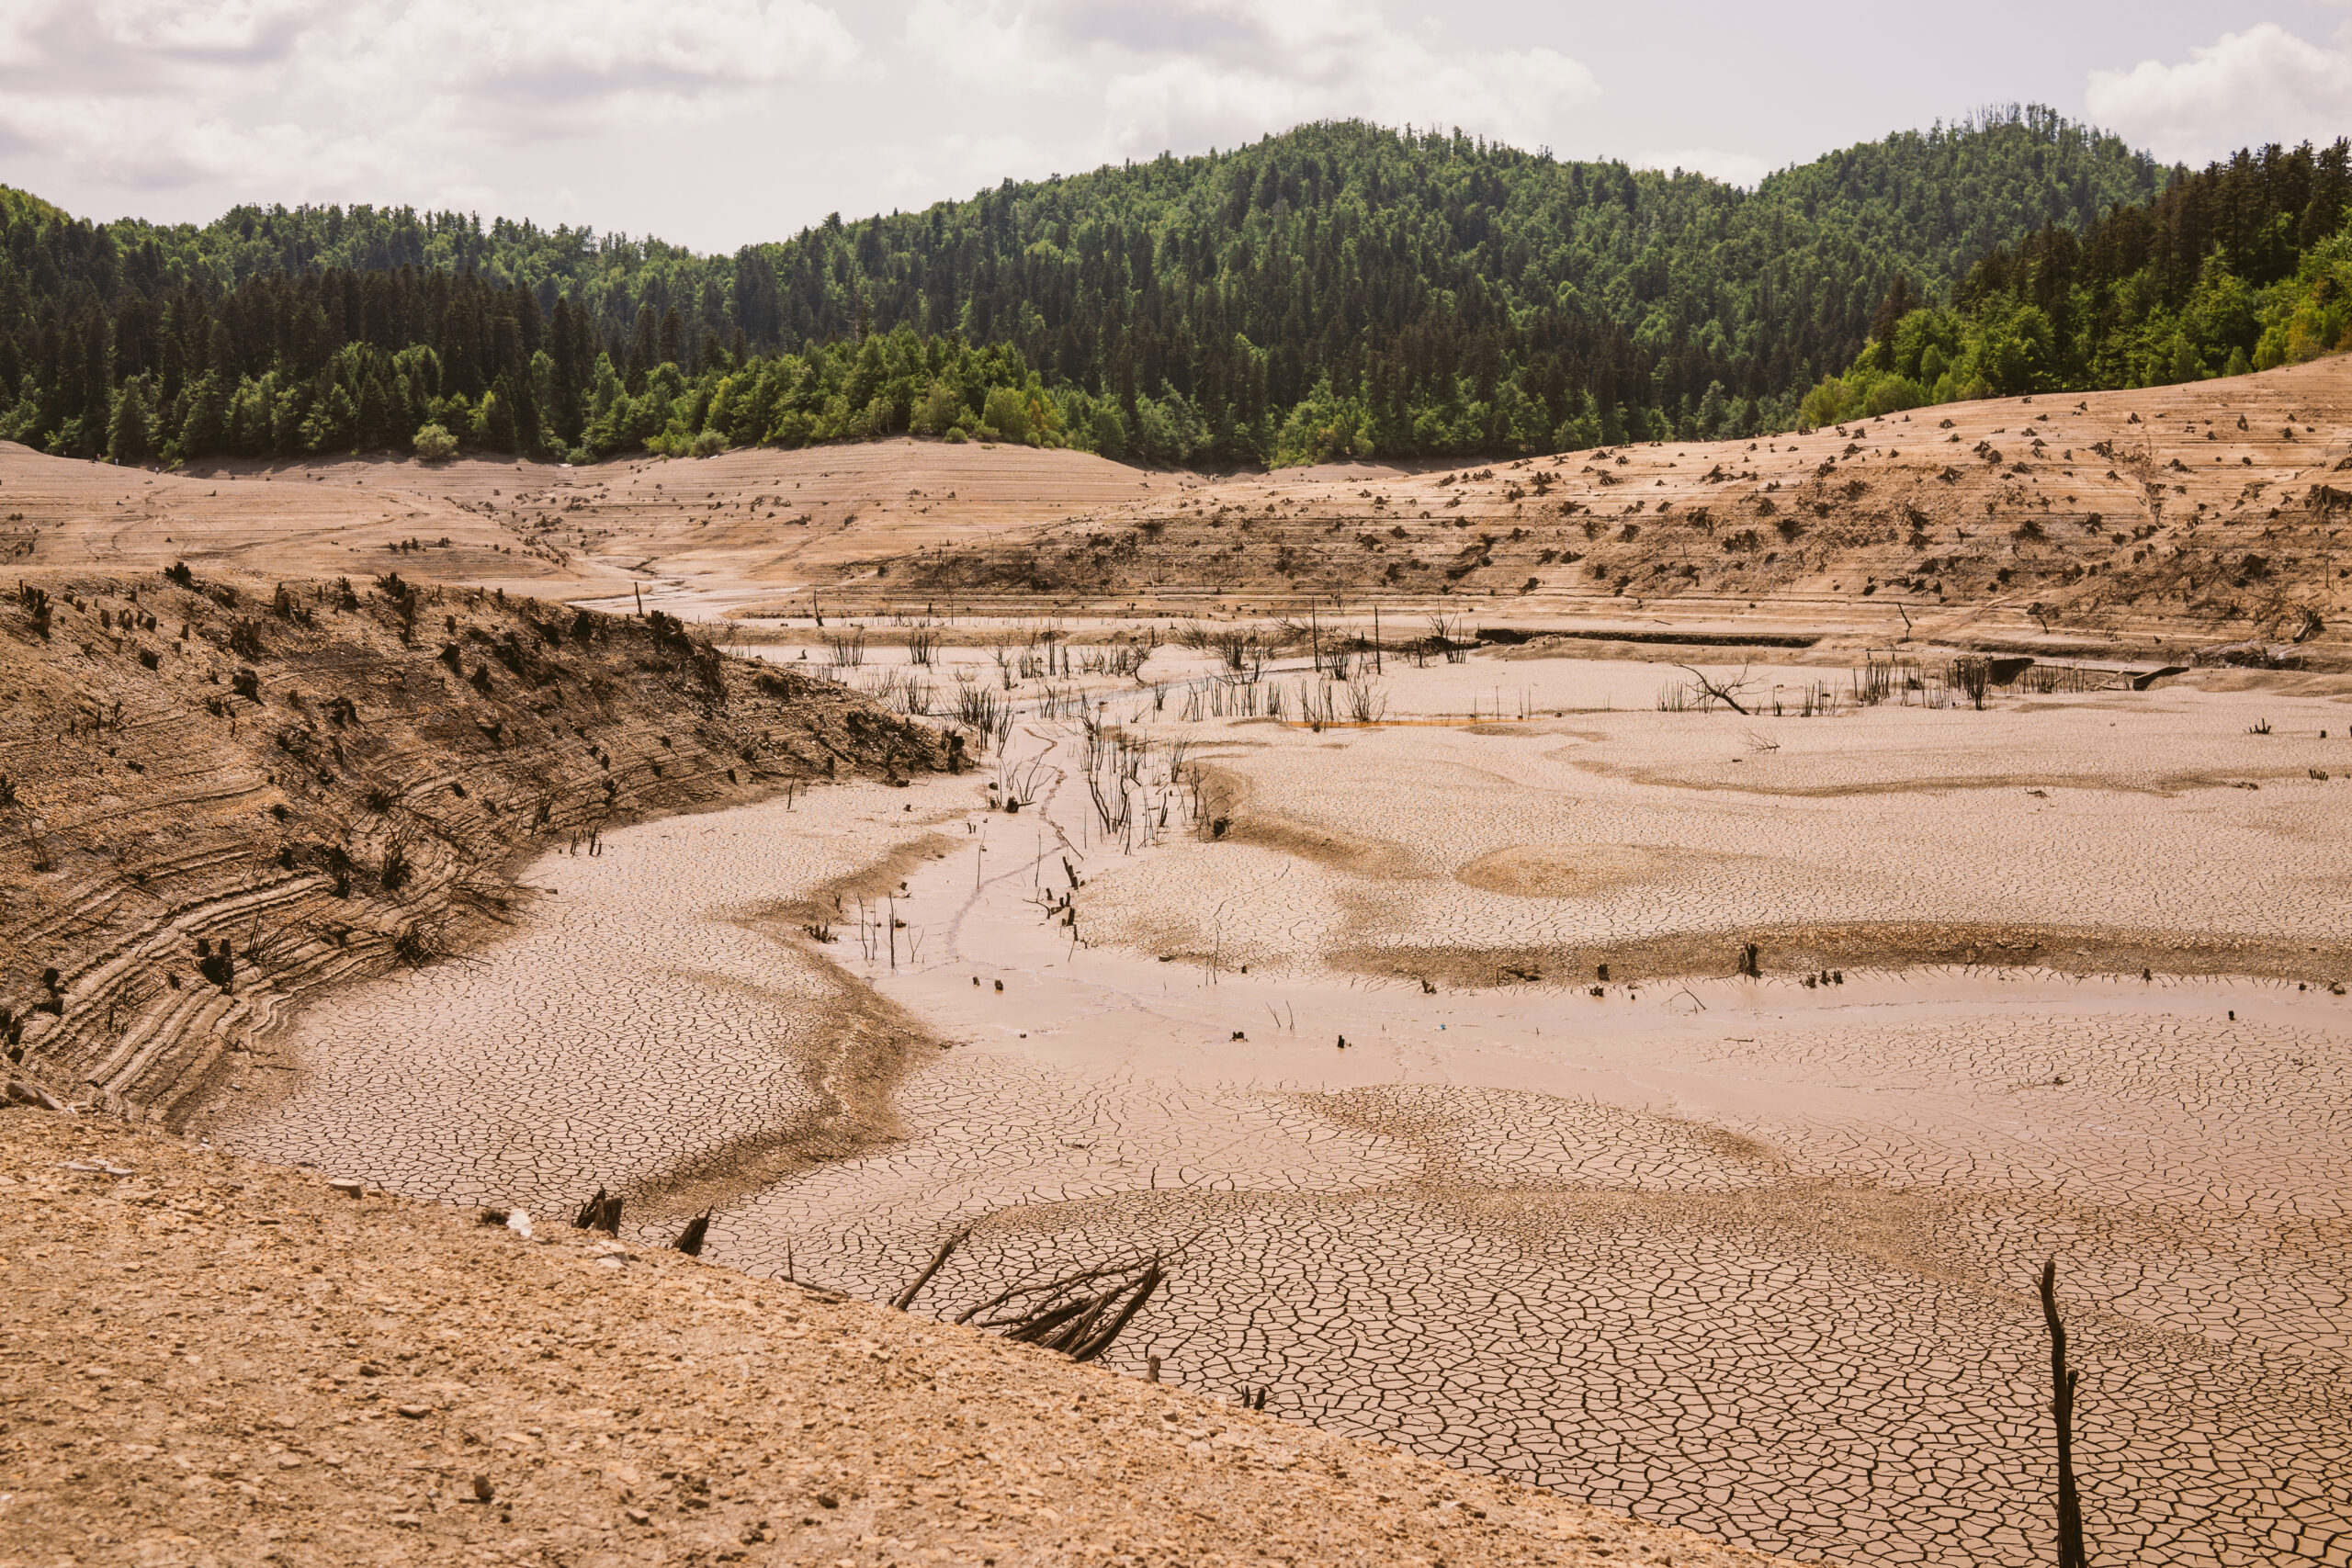
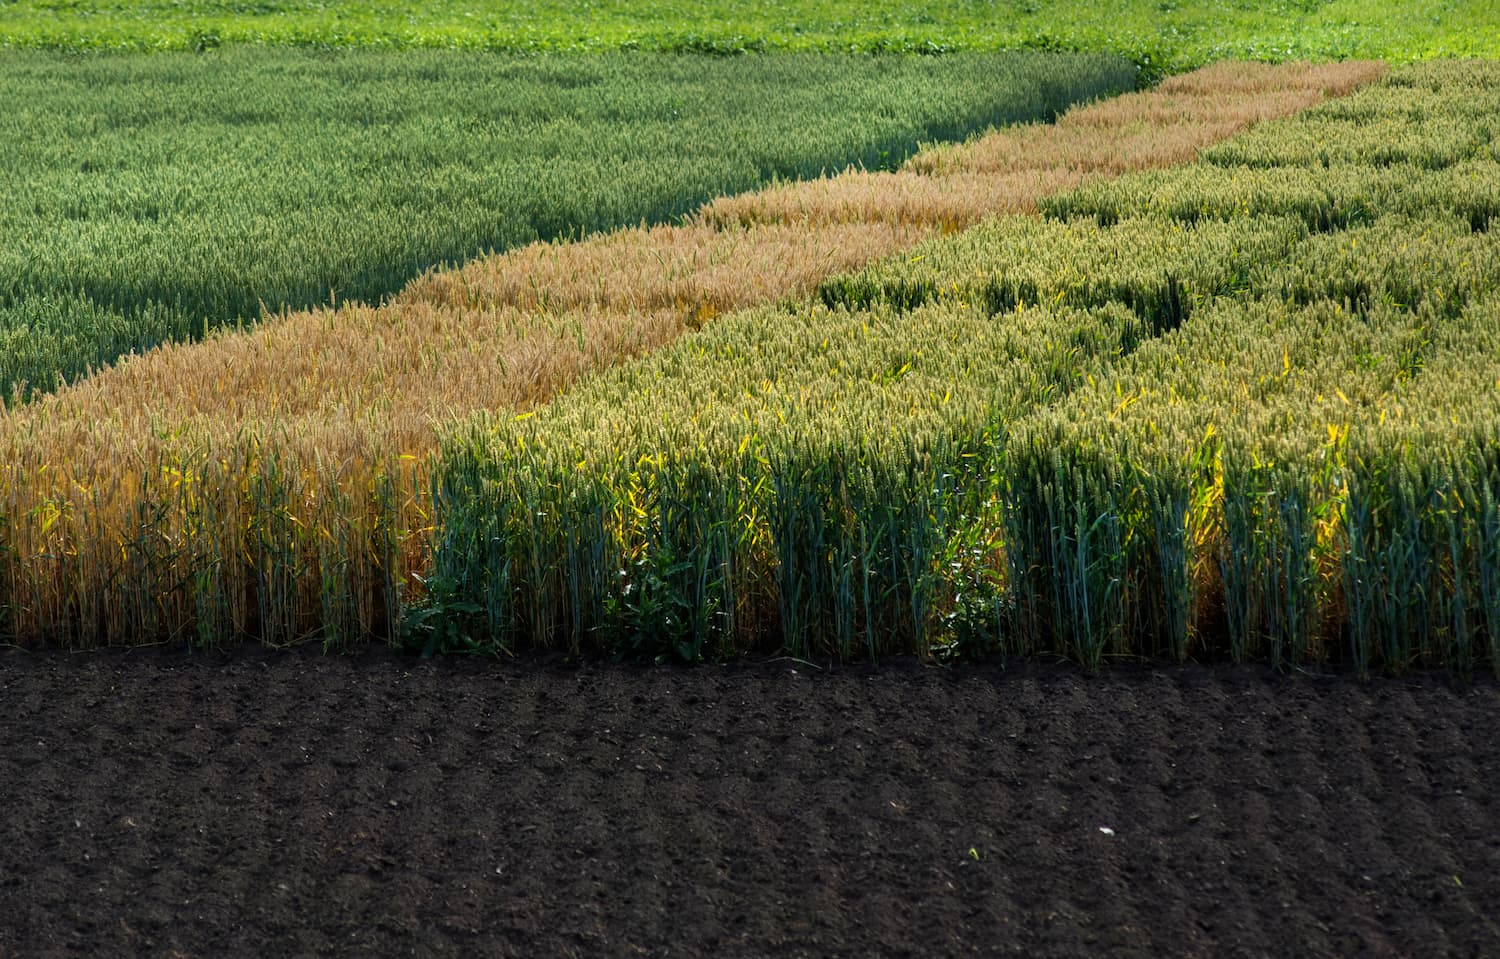
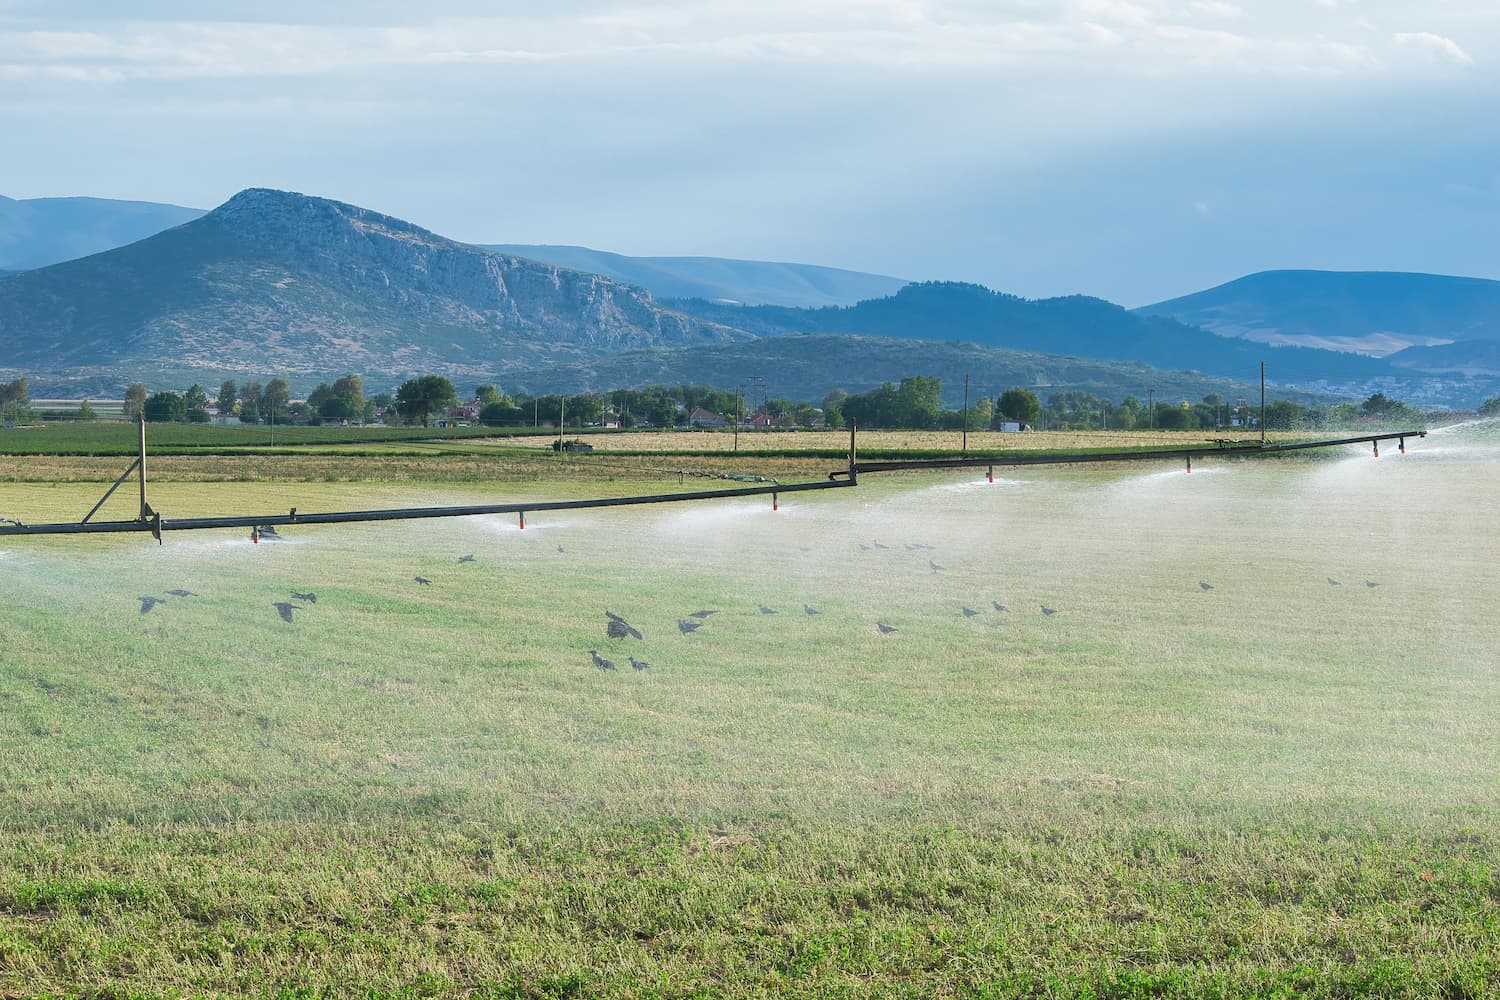
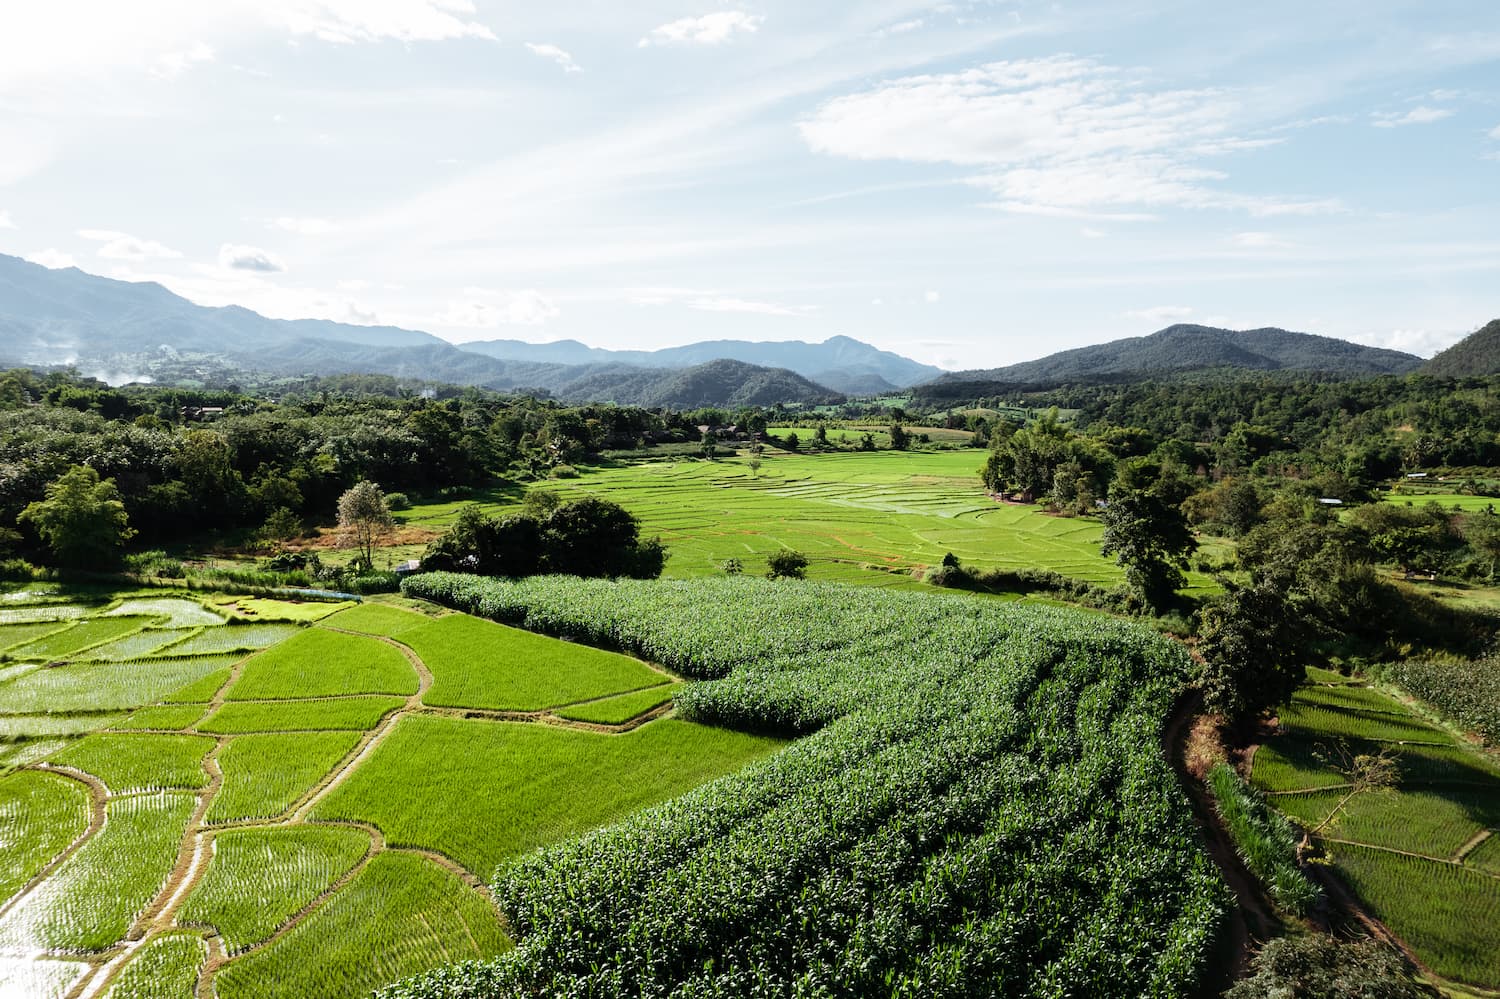
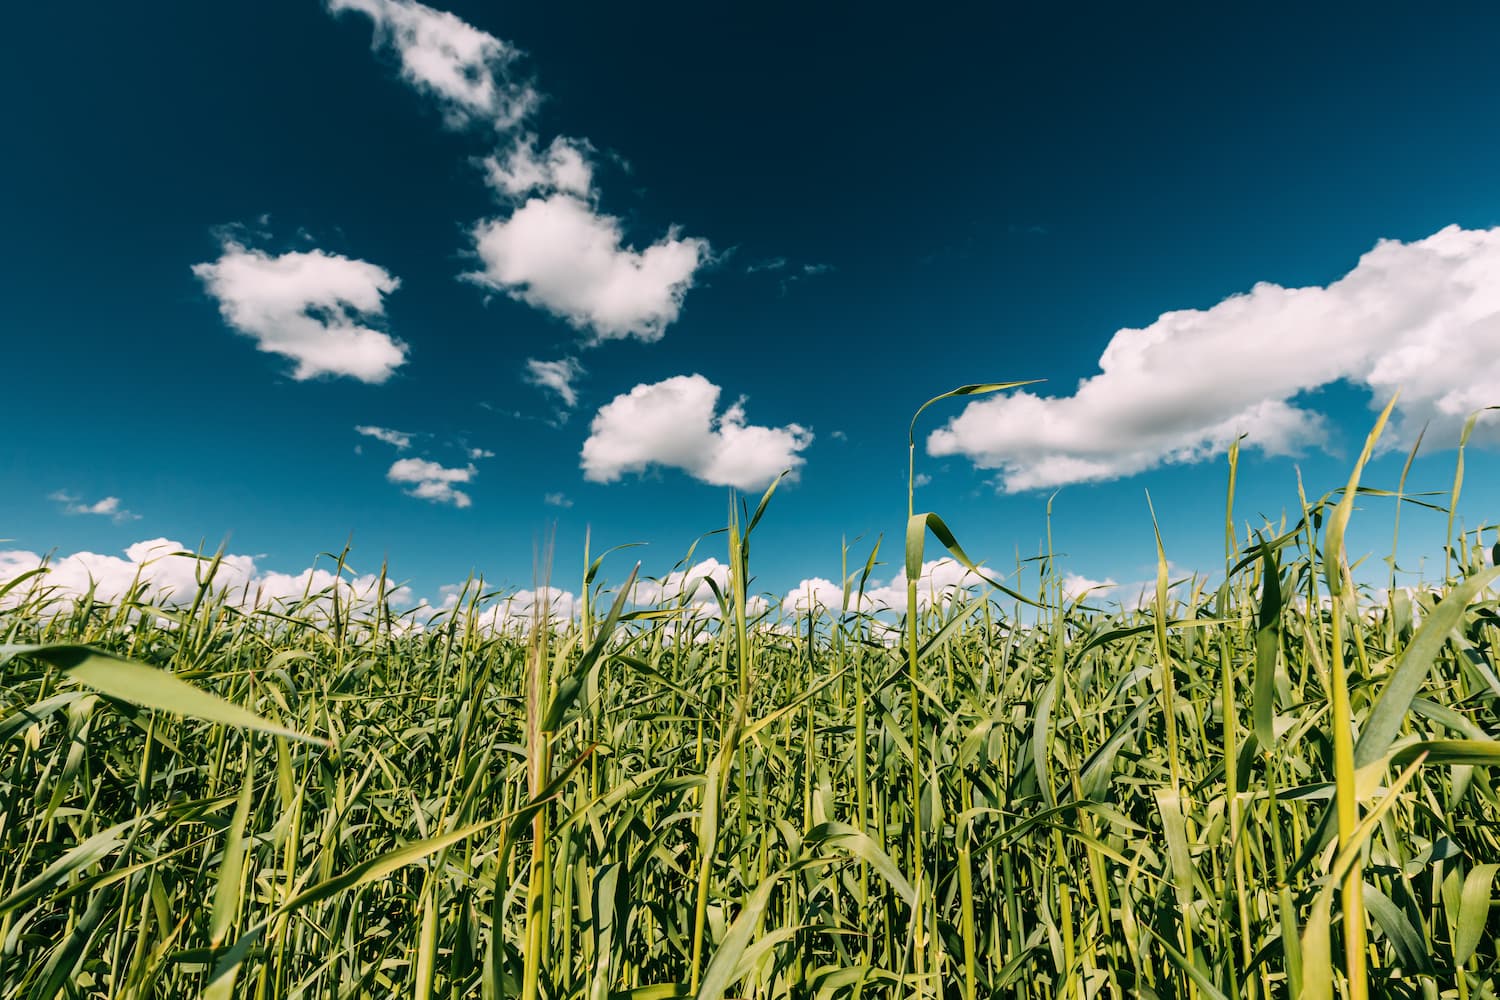
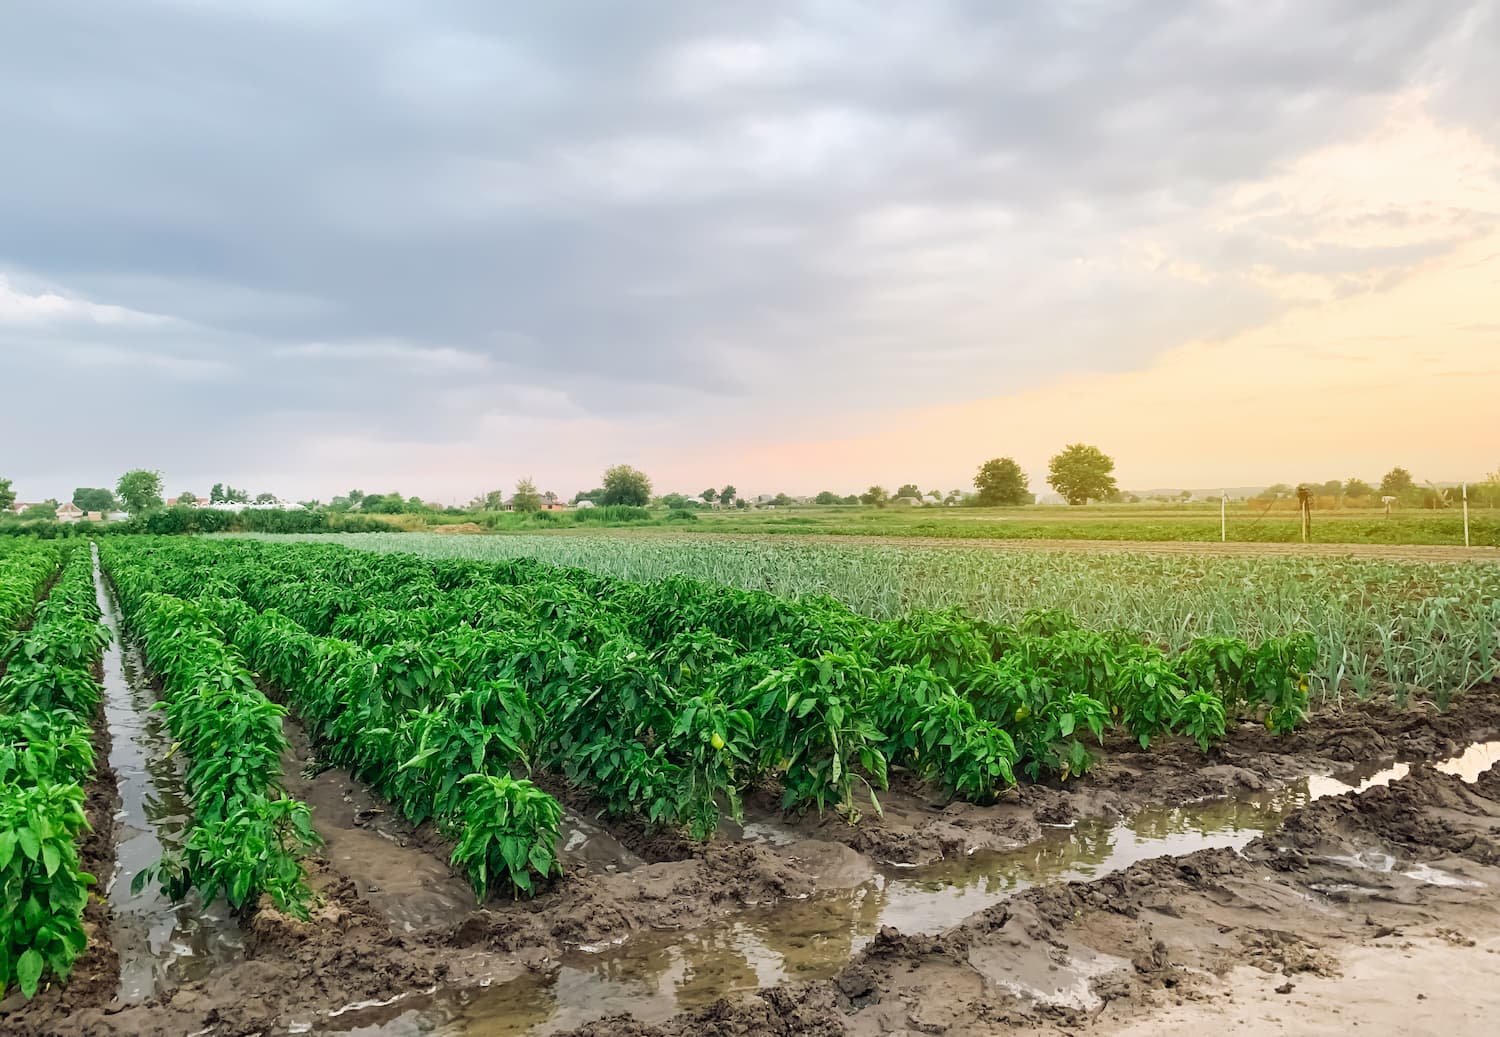
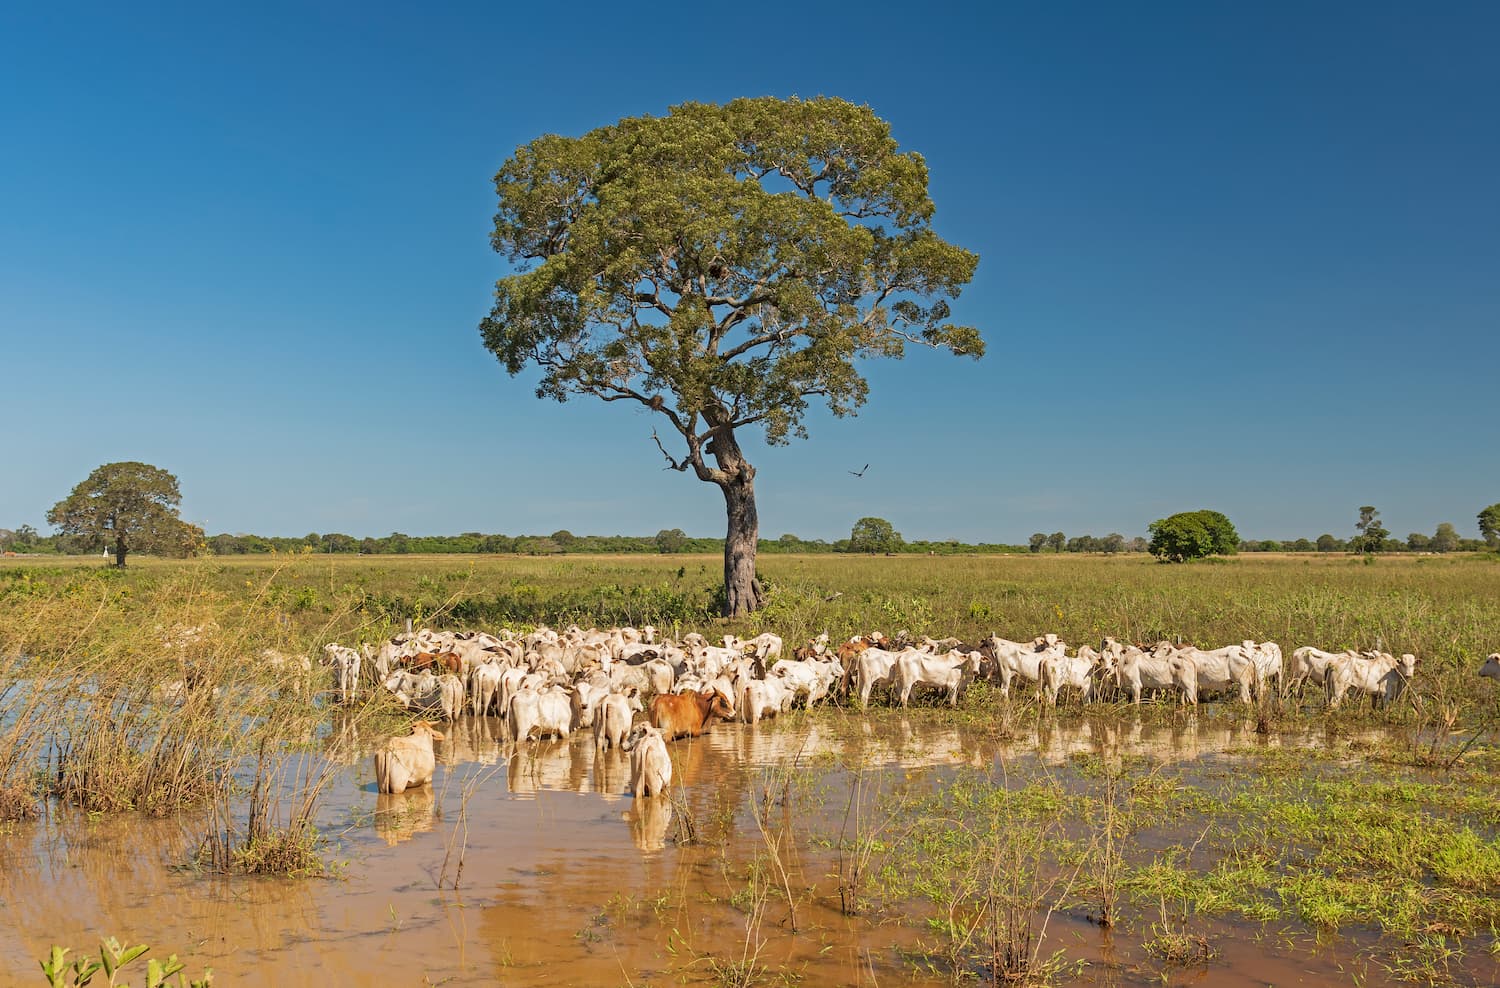
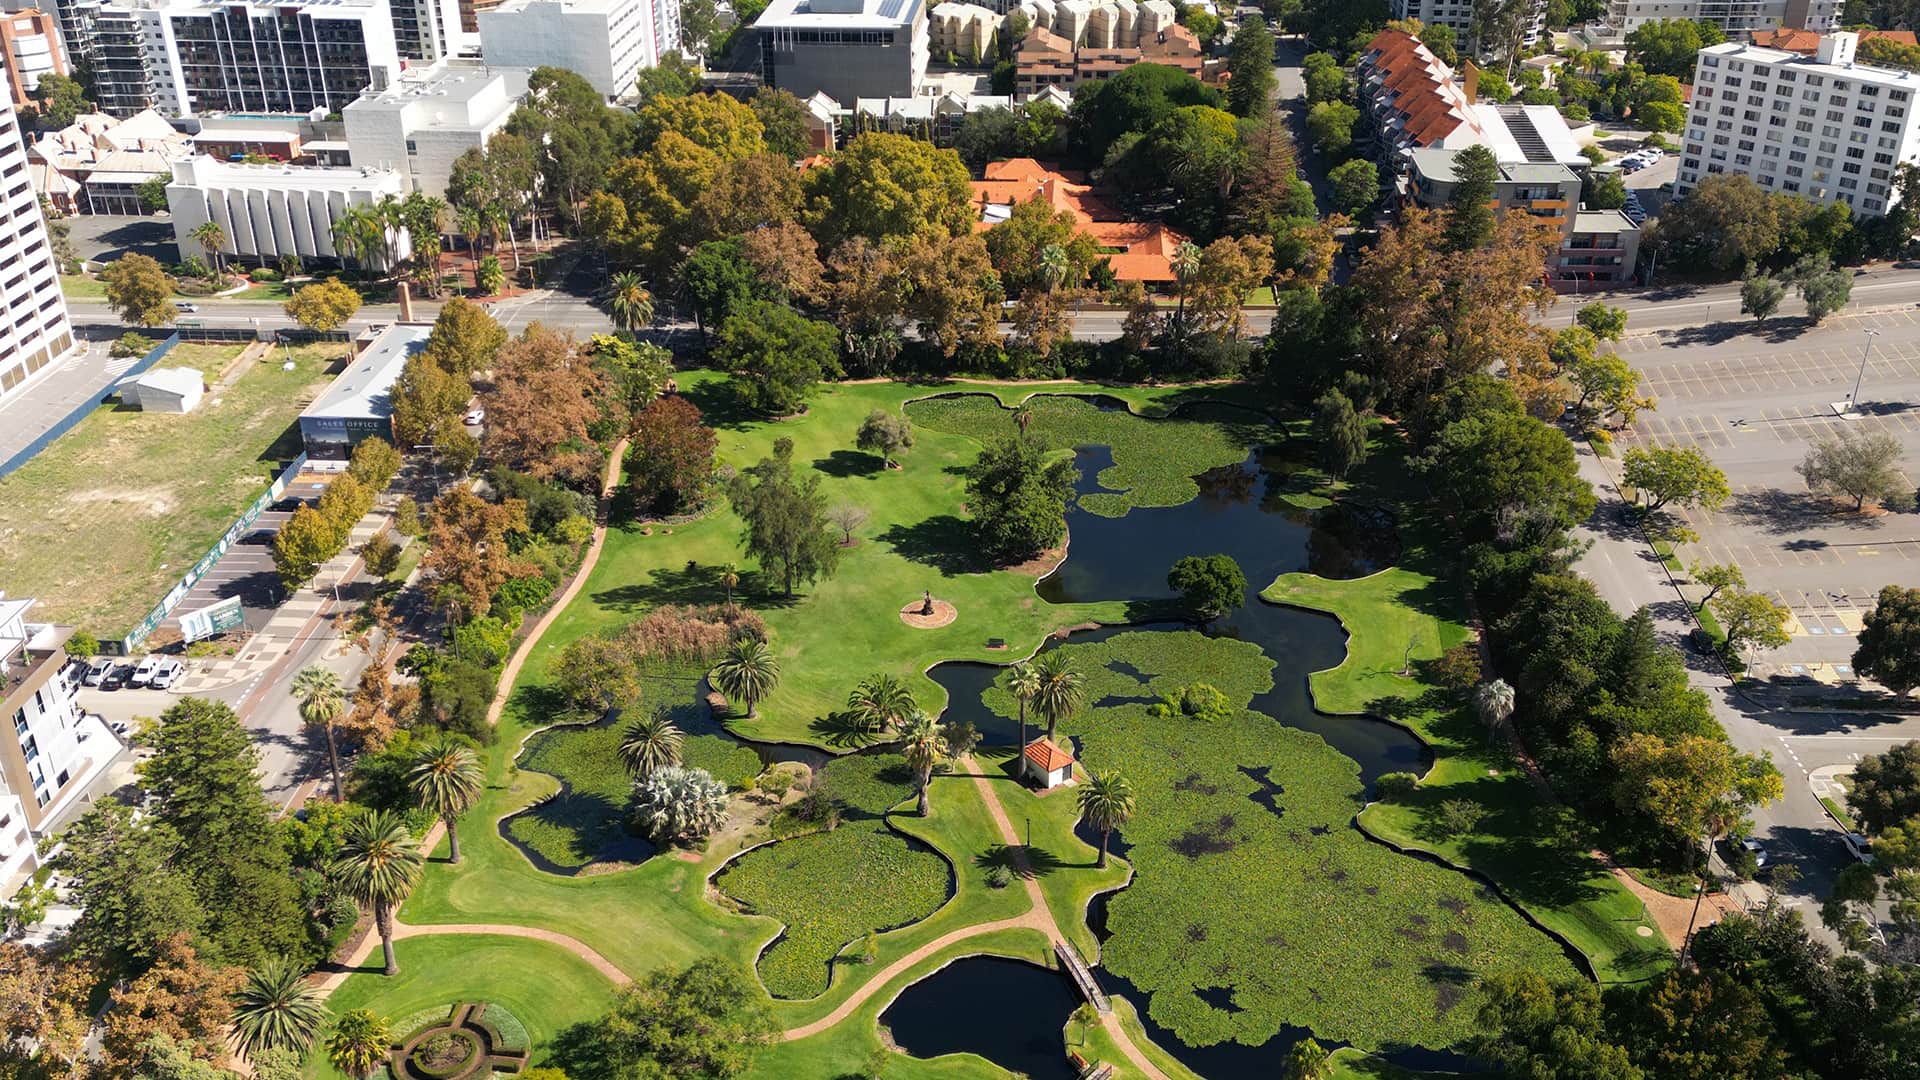
Remote sensing-derived vegetation indices (VIs) provide key information on vegetation conditions and land cover, from local to global scales. Such indices offer quantitative measures of vegetation composition, vigour, biomass, and stress levels in support of many applications such as agriculture, forestry, environmental management, and climate science. Their contribution to large-scale, precise, and consistent monitoring of vegetation and land cover conditions facilitate early warning systems for droughts and land degradation. In agriculture, for example, VIs are often used for monitoring indications of crop water stress or nutrient deficiencies, optimising yield and resource allocation, thereby improving crop management and food security strategies. In forestry, VIs facilitate accurate identification of condition changes related to degradation, deforestation and restoration processes stemming by human or natural causes. VIs play an important role in understanding global environmental changes, offering useful information for policy-makers, researchers, farmers, and land managers to implement sustainable resource management practices.
EO Capability Description
Remote sensing-based Vegetation Indices (VIs) are generated by mathematically combining spectral surface reflectance values from satellite imagery, allowing for precise quantification and characterisation of vegetation properties at multiple scales. VIs are widely used to estimate particular vegetation metrics such as chlorophyll concentration, water content, leaf area, and biomass.
Depending on the specific application requirements some VIs will be more appropriate than others. Multispectral and hyperspectral imagery from optical sensor satellites like Sentinel-2, Landsat, MODIS, PROBA-1, and PRISMA are used to derive spectral indices, such as the Normalized Difference Vegetation Index (NDVI), Enhanced Vegetation Index (EVI), Soil-Adjusted Vegetation Index (SAVI) and Green Chlorophyll Index (GCI). VIs have been built for particular applications such as plant stress detection, land cover type discrimination, and tracking of seasonal dynamics.
Synthetic Aperture Radar (SAR) sensors, such as those carried on the Sentinel-1 constellation, have also been employed to derive vegetation indicators, like the Radar Vegetation Index (RVI), however, they are more commonly used to provide complementing insights to optical information, as they provide information on vegetation structure, as well as in place of optical sensors, when limited (e.g. due to frequent cloud cover).
Hyperspectral imaging and LiDAR can complement vegetation assessments further by capturing spectral signatures and structural attributes in more detail. Advanced machine learning algorithms and cloud computing platforms enable near-real-time vegetation monitoring at global scale, enabling early detection of environmental changes.
Indicative Cost Range Details
Users can either generate their own vegetation indices using Sentinel-2 (10m) or Landsat-8/9 (30m) imagery, or make use of one of the many pre-calculated datasets such as the 10-daily 300m NDVI by the Copernicus Land Monitoring Service. Commercial offerings either follow a subscription model as part of all-in-one agricultural monitoring solutions or by providing on-demand bundles of indices starting at around 1.20 EUR/km².
EO Capability on GDA APP
Indicative Cost Range
Free, subscription or from ~1.20 EUR/km²