Wind Speed
EO Capability Benefits
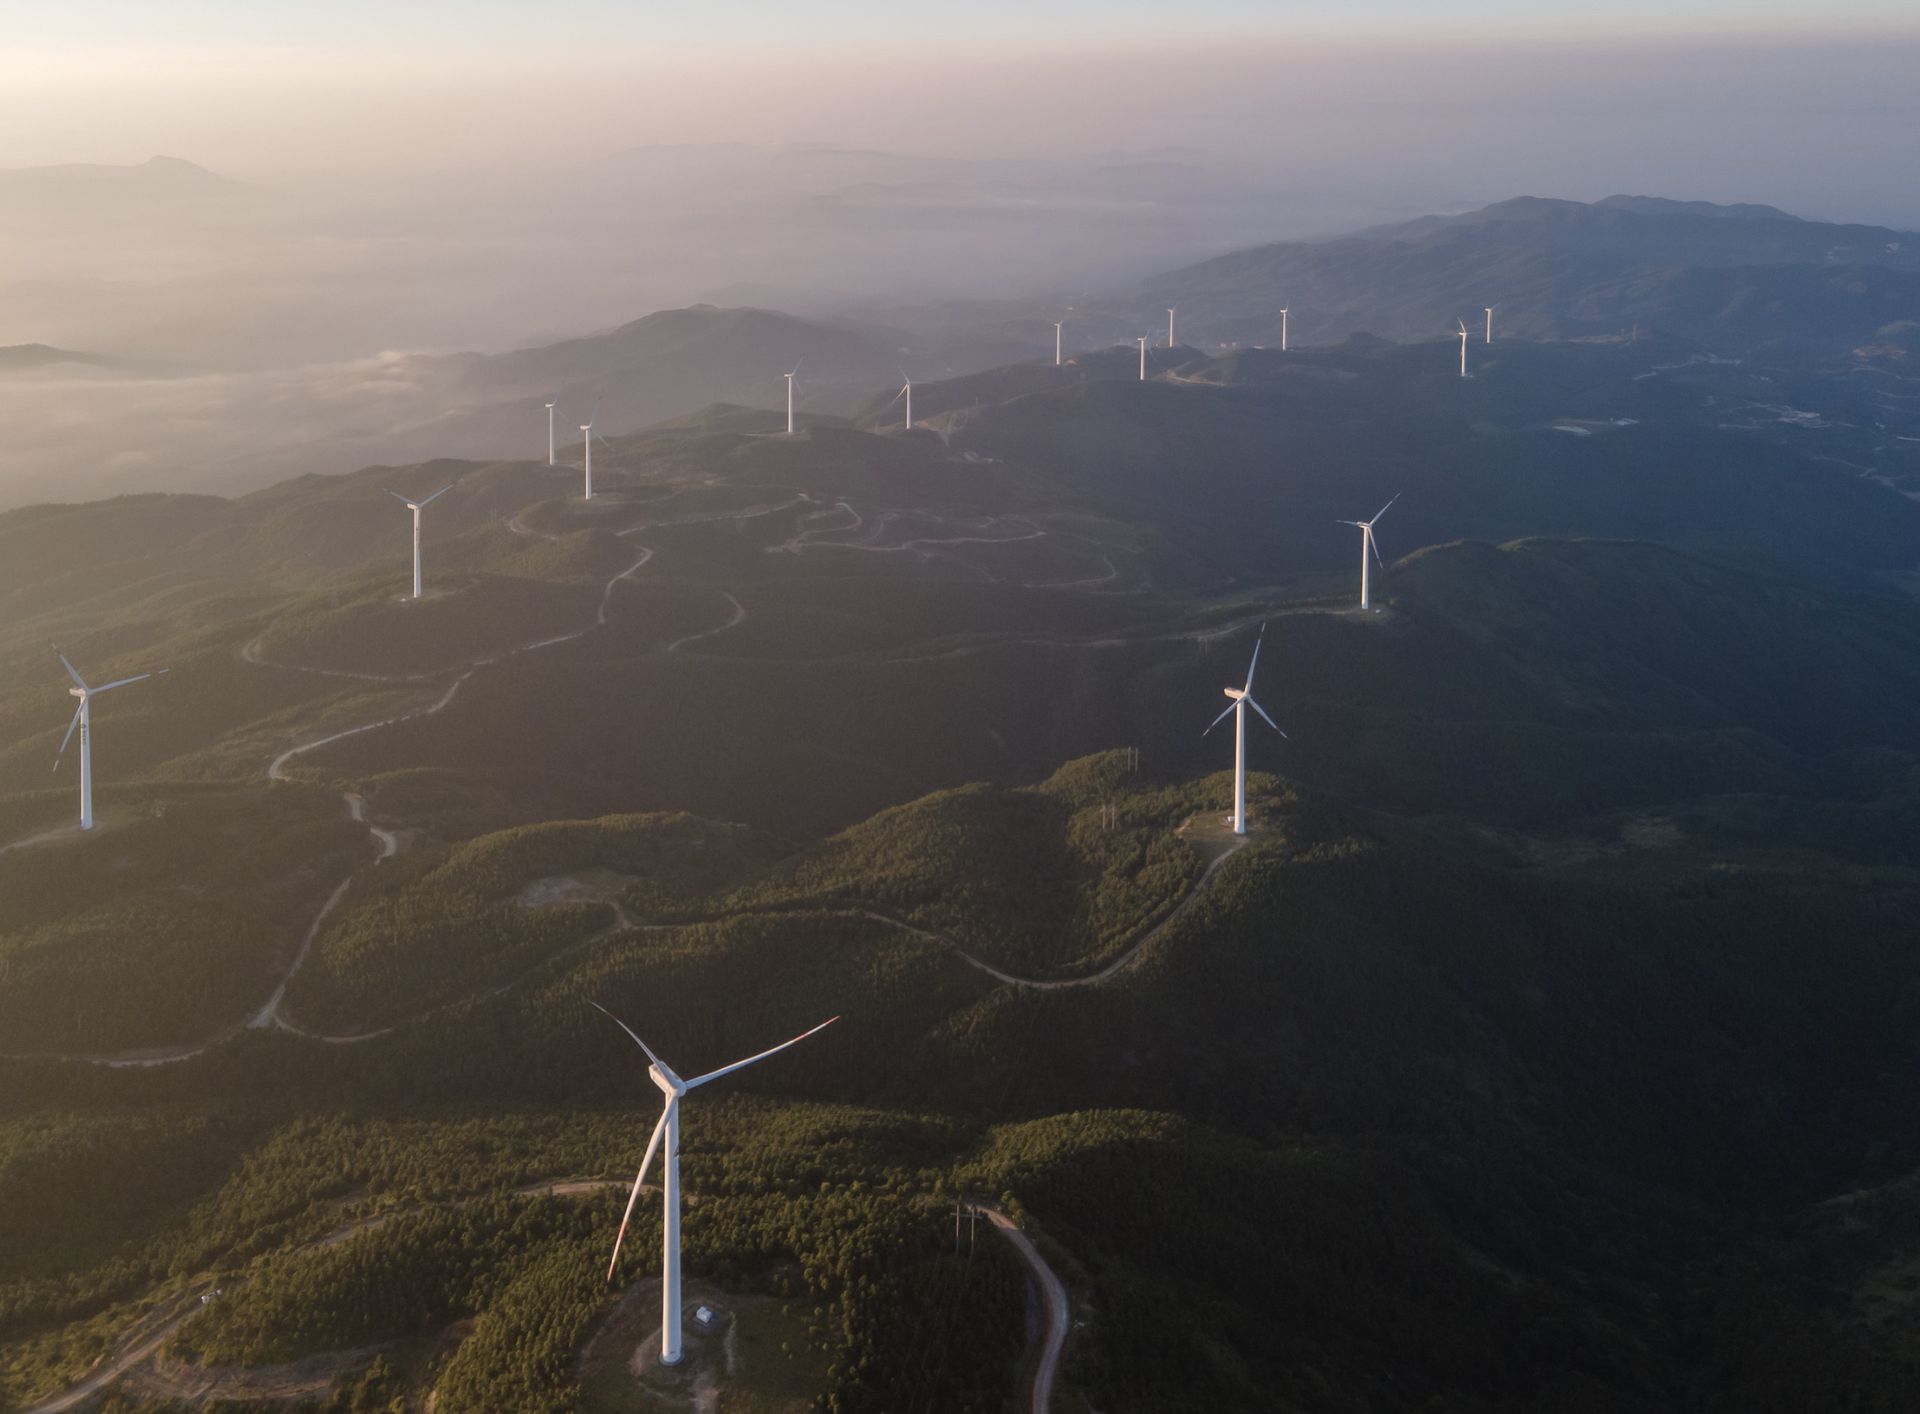
Wind speed data is essential to identify optimal locations for wind turbines, optimise energy production, and design structures such as buildings and bridges that can withstand specific wind loads. It is also critical for forecasting severe weather events and understanding long-term climate patterns. Beyond characterising typical wind conditions, estimating extreme wind speeds and how these may shift under future climate scenarios is critical for assessing risks to energy infrastructure such as wind turbines and power transmission lines, which are designed to operate within specific maximum wind thresholds.
EO Capability Description
Wind speed data is often stored as gridded datasets, where each grid cell contains a value representing the wind speed at that location, typically expressed in metres per second. Temporal resolution, which is how frequently data is recorded, varies depending on the application. Hourly or sub-hourly datasets are used for real-time monitoring, forecasting, and wind energy site assessments, whereas daily or monthly averages are more suited to climate studies and long-term trend analysis. A wind atlas, which is a map of average wind speed and power density values across a region, is a particularly useful tool in renewable energy assessments, for example to identify the most suitable locations for wind turbines. Wind atlases can cover areas ranging from small regions to entire countries.
Earth Observation (EO)-based wind speed data combines remote sensing technologies with atmospheric models. Data from multiple EO sensors, capturing terrain and land-use information, is used as input for Computational Fluid Dynamics (CFD) models (such as FITNAH-3D), which simulate wind conditions at different altitudes. The high quality of EO data allows for fine spatial resolution, resulting in precise wind data outputs. Where additional data such as on-site measurements or operational turbine data is available, it can be used for model validation and adjustment.
Extreme wind speed estimation builds on this same foundation. It relies on long-term wind speed time series, typically spanning several decades, derived from EO-based datasets such as reanalysis products (gridded reconstructions of historical atmospheric conditions) and satellite observations. Annual wind speed maxima are extracted from these time series and modelled using the Gumbel distribution, a probability distribution widely used in extreme value statistics (a branch of statistics concerned with the likelihood of rare, high-magnitude events). The extreme wind speed for a given location is then estimated by fitting this distribution to the extracted annual maxima.
Depending on the complexity of the application and data availability, EO-based wind speed and extreme wind products can be tailored to different levels of detail:
Basic: Use of global wind products such as the Global Wind Atlas for coarse-resolution wind speed estimates suitable for initial site screening, combined with straightforward application of the Gumbel distribution to an existing reanalysis or satellite-derived time series to estimate return-period wind speeds.
Intermediate: EO-derived terrain and land-use data fed into CFD models at local scale, enabling higher spatial resolution, particularly important in complex terrain such as valleys, ridges, or coastal zones. For extreme wind estimation, high-resolution time series derived from mesoscale atmospheric models such as the Weather Research and Forecasting (WRF) model, combined with machine learning and spectral post-processing, improve accuracy at specific locations and hub heights.
Advanced: Integration of on-site measurements or operational turbine data for model validation and fine-tuning. For climate impact assessments, regional climate model ensembles from the Coordinated Regional Climate Downscaling Experiment (CORDEX) initiative provide time series of daily maximum near-surface wind speed under various emissions scenarios. Comparing extreme wind estimates for a reference and a future period yields a change signal that can be spatially mapped to energy infrastructure, allowing planners to account for shifting risk profiles over time.