
Lake Victoria Water Pollution Part 2 – Introduction
Training Resource Description
Lake Victoria supports over 40 million people, but increasing pollution has led to rising levels of algae blooms and chlorophyll-a in areas that were previously clean. This underscores the need to understand the key drivers behind these changes.
Satellite-based Earth Observation systems, supported through collaborations with the ESA GDA programme, provide a wide and detailed view of the lake basin. These technologies help identify pollution hotspots, track changes over time, and monitor key water quality parameters such as chlorophyll-a, turbidity, and harmful algal blooms. They also enable real-time observation of risks like oil spills and invasive water hyacinth, allowing for faster and more targeted responses.
To support sustainable management, a Lake Victoria Water Information System is being developed. By consolidating environmental data, it will guide policy and decision-making, helping to protect the lake and its resources for the environment, the economy, and future generations.
In the video, you will hear from key stakeholders working to monitor and protect Lake Victoria, including representatives from the Lake Victoria Basin Commission and the World Bank.
Related resources and websites
- GDA Story: Battling Pollution in Lake Victoria – read more about the Lake Victoria project on the GDA website
- GDA Impact Sphere: Addressing pollution threats to Lake Victoria – view this Case Study on thew GDA Impact Sphere
- Lake Victoria Basin Water information System (LVB-WIS) – Find out more about the upcoming Lake Victoria Basin Water Information System
Featured Imagery
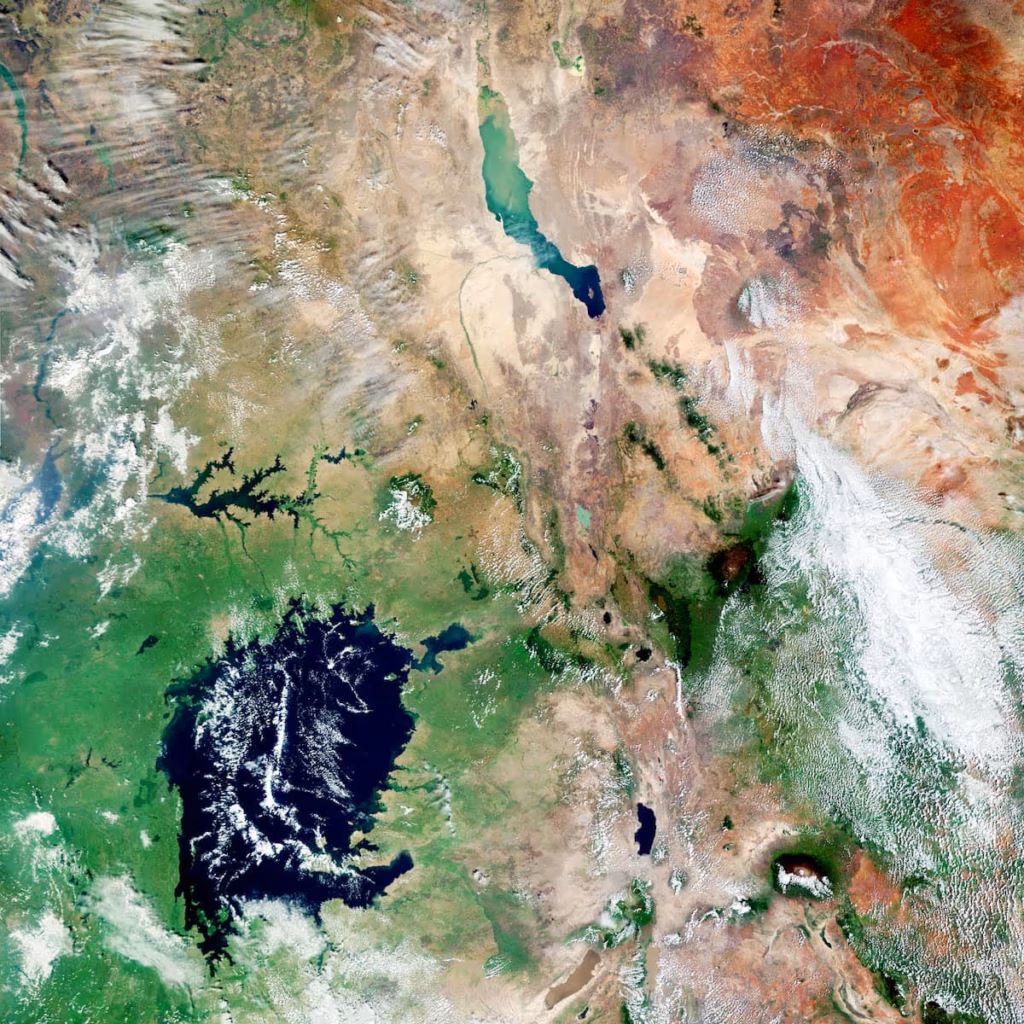
This satellite image, captured by Copernicus Sentinel-3, shows two major East African lakes – Lake Victoria and Lake Turkana.
Source: contains modified Copernicus Sentinel (2021), processed by ESA

Image captured on 14 March 2016 by the MODIS instrument, aboard the Aqua satellite
Source: NASA
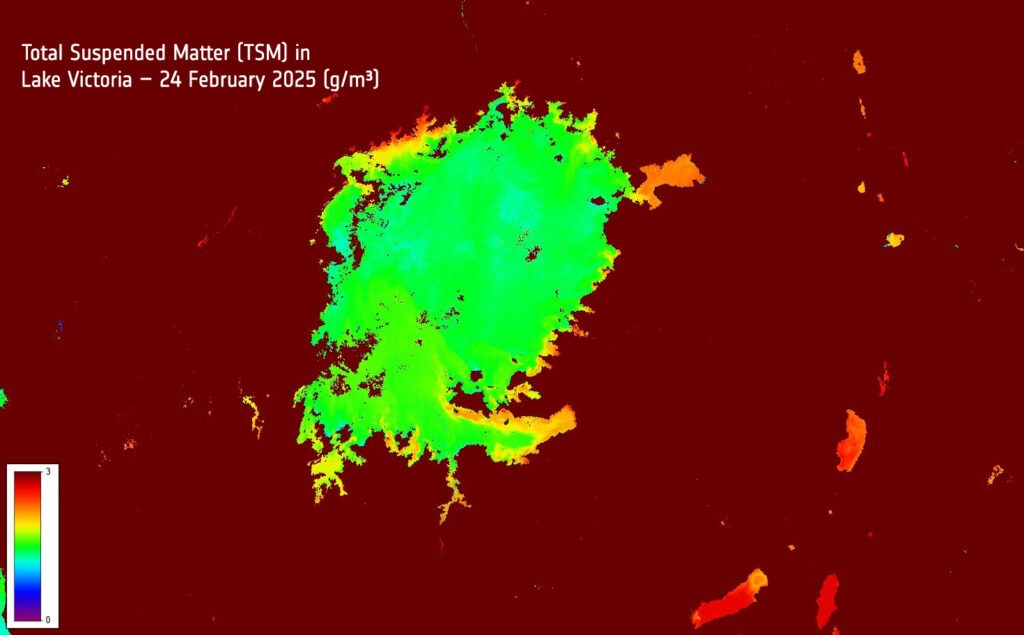
This image, captured by the Copernicus Sentinel-3, shows total suspended matter (TSM) concentrations in Lake Victoria, with green indicating lower and yellow to red showing higher turbidity, especially near shorelines and river inflows. Dark red areas represent land or non-water regions.
Source: European Union, contains modified Copernicus Sentinel data 2025, processed with EO Browser.

This image, taken by the Earth Observing 1 satellite, shows swathes of water hyacinths in Osodo Bay in the Winam Gulf, Lake Victoria, Kenya.
Source: NASA