
Flood Mapping with Sentinel-2 Thresholding – Part 3
Training Resource Description
The next step is to create the water mask in a WebGIS called EO Browser by using a water index (MNDWI). A threshold is used to distinguish between water and non-water areas. You will determine the threshold directly in EO Browser using a histogram of the water index and the data collection visualization for the study area.
To get a first overview of the features and collections of data, that are included in EO Browser, please click on the image below.
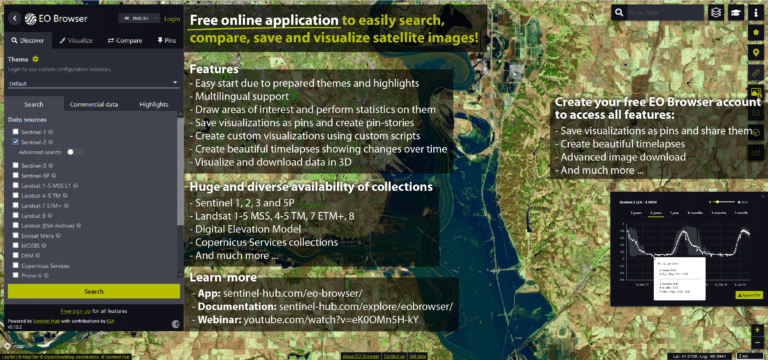
Are you ready to work with the data? In the video below, we will explain the steps to derive flooding extent based on optical Sentinel-2 imagery in the EO Browser platform. In this tutorial we will be using the Modified Normalized Difference Water Index (MNDWI) after Xu 2006, which consists of a ratio between the green and the short-wave infrared channel (bands 3 and 11). The analysis can also be carried out with data from different sensors, such as Landsat or Sentinel-2. An indication of wavelengths that need to be used was given in an earlier video.
You can access the EO Browser here: Sentinel Hub EO Browser