

Forest Monitoring Part 1 – Introduction
 ADD TO E-PORTFOLIO
 SUGGEST AN EDIT
ADD TO E-PORTFOLIO
SUGGEST AN EDIT
SUGGEST AN EDIT
ADD TO E-PORTFOLIO
SUGGEST AN EDIT
Training Resource Description
Forest ecosystems in Mexico cover over 70% of the country’s land area. Around 11.9 million people live in forested areas, with 30% inhabited by Indigenous Peoples. Forest ecosystems are very important for the population and economy, providing jobs, ecosystem services, as well as protection against disasters such as hurricanes, floods, and heavy rain. However, Mexico’s annual deforestation rate is approximately 207,665 hectares per year.
The GDA Forest Management activity, in collaboration with the World Bank, and counterparts in La Comisión Nacional Forestal (CONAFOR), are working to address these challenges, focusing on Durango, Mexico. The state of Durango was chosen due its complex location – no detailed mapping of forest cover is available, due to challenges collecting reliable and consistent data on forest condition and change.
Two products were created for the first development cycle: High-resolution land cover maps – using Sentinel-2 optical imagery with local secondary data and Tree cover density (TCD) mapping – produced by 10m resolution Sentinel-2 imagery. In the future, the products and information being developed will make it possible to identify where conservation, protection, and restoration actions can be carried out most effectively, and where to promote sustainable forest management.
In this video, you will hear from national and local forestry authorities, along with a World Bank specialist, explain how how Earth Observation is helping Mexico address forest degradation by improving forest monitoring in Durango.
Related resources and websites
- GDA Story: Satellite Data Supports Forest Inventories in Mexico – Read more about this case study on the GDA website
- Mexico Strengthening Entrepreneurship in Productive Forest Landscapes Project – TheWorld Bank project
Featured Imagery
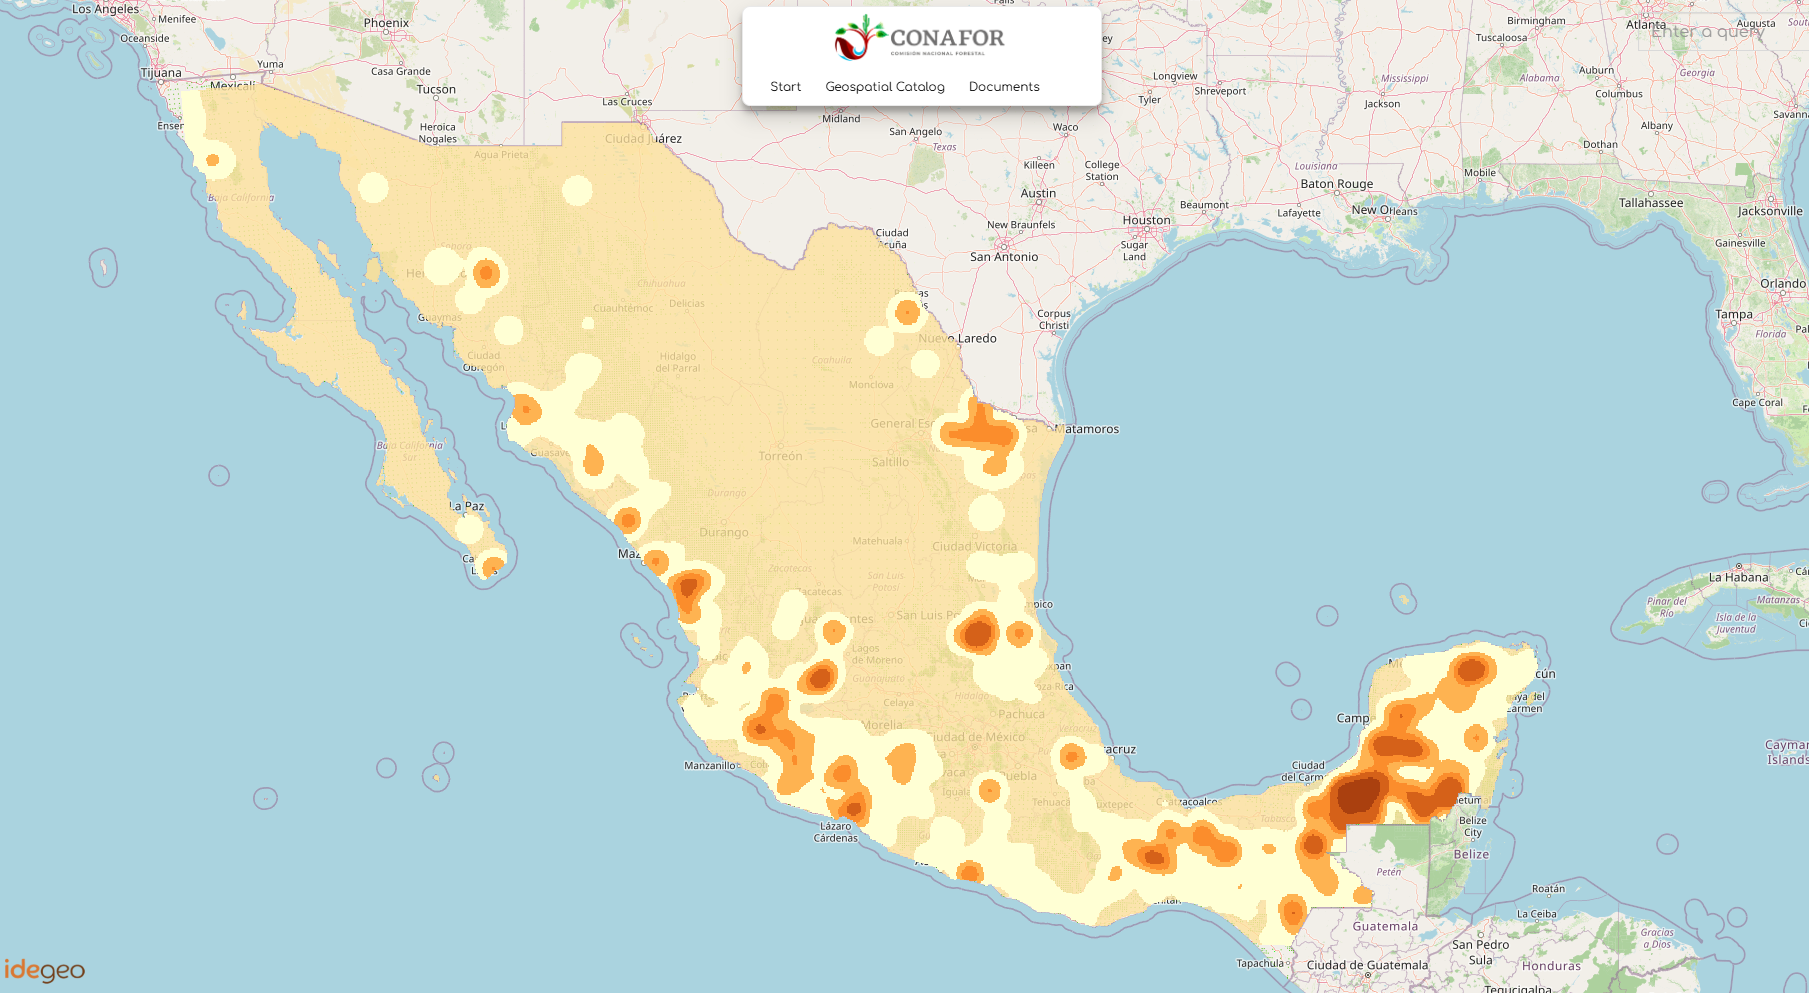
This map shows Mexico’s critical deforestation zones from 2001 to 2024, visualised as a heat map. Areas with higher deforestation intensity appear in darker orange and red, while lower‑intensity zones are shown in lighter yellow. The pattern highlights concentrated deforestation in regions such as the Yucatán Peninsula, central Mexico, and parts of the Pacific coast.
Source: CONAFOR
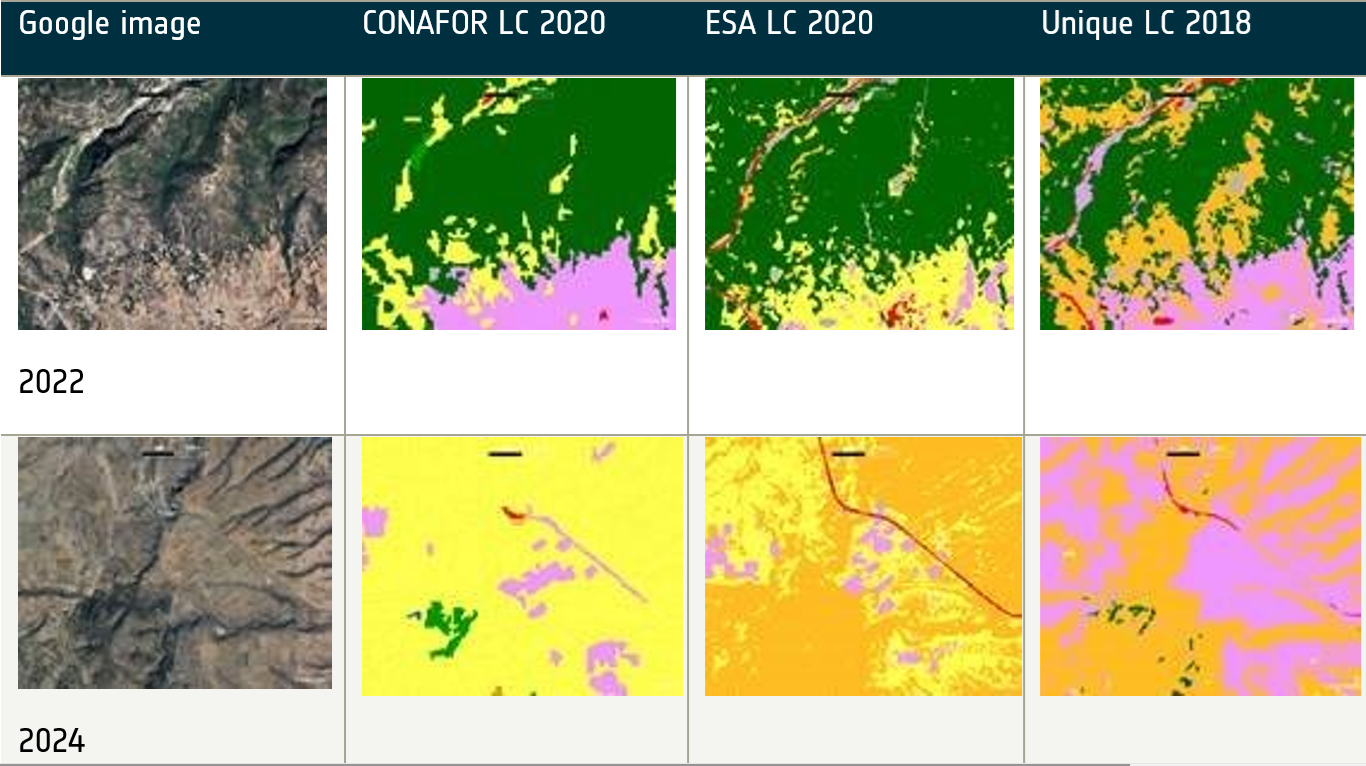
This image presents a side‑by‑side comparison of land‑cover classifications for the same region in Mexico across two years, 2022 and 2024. The first column shows the raw satellite view, while the other columns display land‑cover maps produced by different datasets: CONAFOR LC 2020, ESA LC 2020, and Unique LC 2018.
Source: GDA AID Forest Management Consortium

Sentinel-2 optical image of Durango, Mexico
Source: Modified Copernicus Sentinel Data 2026, processed with Copernicus Browser
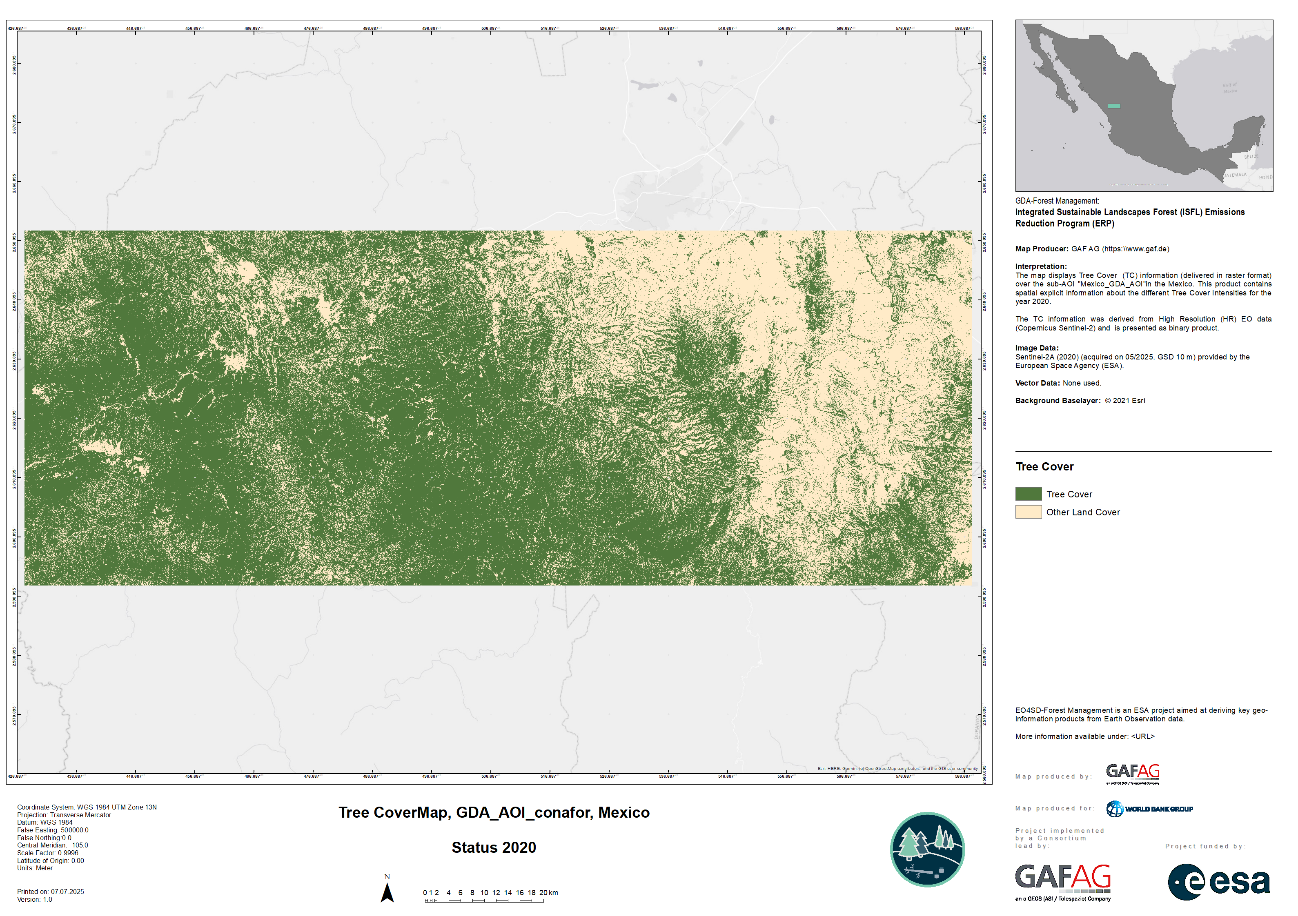
This map shows the tree‑cover distribution within the study area in Durango, Mexico in 2020. The green areas show tree cover and the beige represents other land cover types.
Source: GDA AID Forest Management Consortium