
South Sudan Flooding Part 2 – Introduction
Training Resource Description
Part 2 highlights how the GDA programme, in partnership with the World Bank, and the government of South Sudan, is transforming flood management in the country. By using satellite based Earth Observation (EO) data alongside limited ground measurements, GDA has supported the development of detailed flood hazard and exposure maps, as well as innovative flood monitoring and forecasting tools.
These tools combine long-term rainfall data, flood extent analysis, and information on population, infrastructure, and essential services to help identify the most vulnerable areas. Through training, workshops, and collaboration with local institutions, the project is strengthening national capacity to interpret and apply this data. As a result, policymakers can make more informed decisions, infrastructure planning is becoming more resilient, and communities are receiving earlier and more accurate warnings, enabling them to better prepare for, adapt to, and reduce the impact of recurring floods.
In this video, you will hear from government officials, World Bank specialists, trainees, and community members about how South Sudan is using technology and collaboration to respond to floods.
Related resources and websites
- GDA Story: Flooding Management in South Sudan – Read more about this Case Study on the GDA website
- GDA Story: Climate Resilience in South Sudan – Find out more about how GDA and the World Bank are using satellite data to boost climate resilience and water management in South Sudan
Featured Imagery

Map showing normalized flood frequency (Jan 2015- Dec 2022) derived from Sentinel -1 data that shows the most frequently flooded areas within South Sudan
Source: GDA Climate Resilience / GDA Impact Sphere
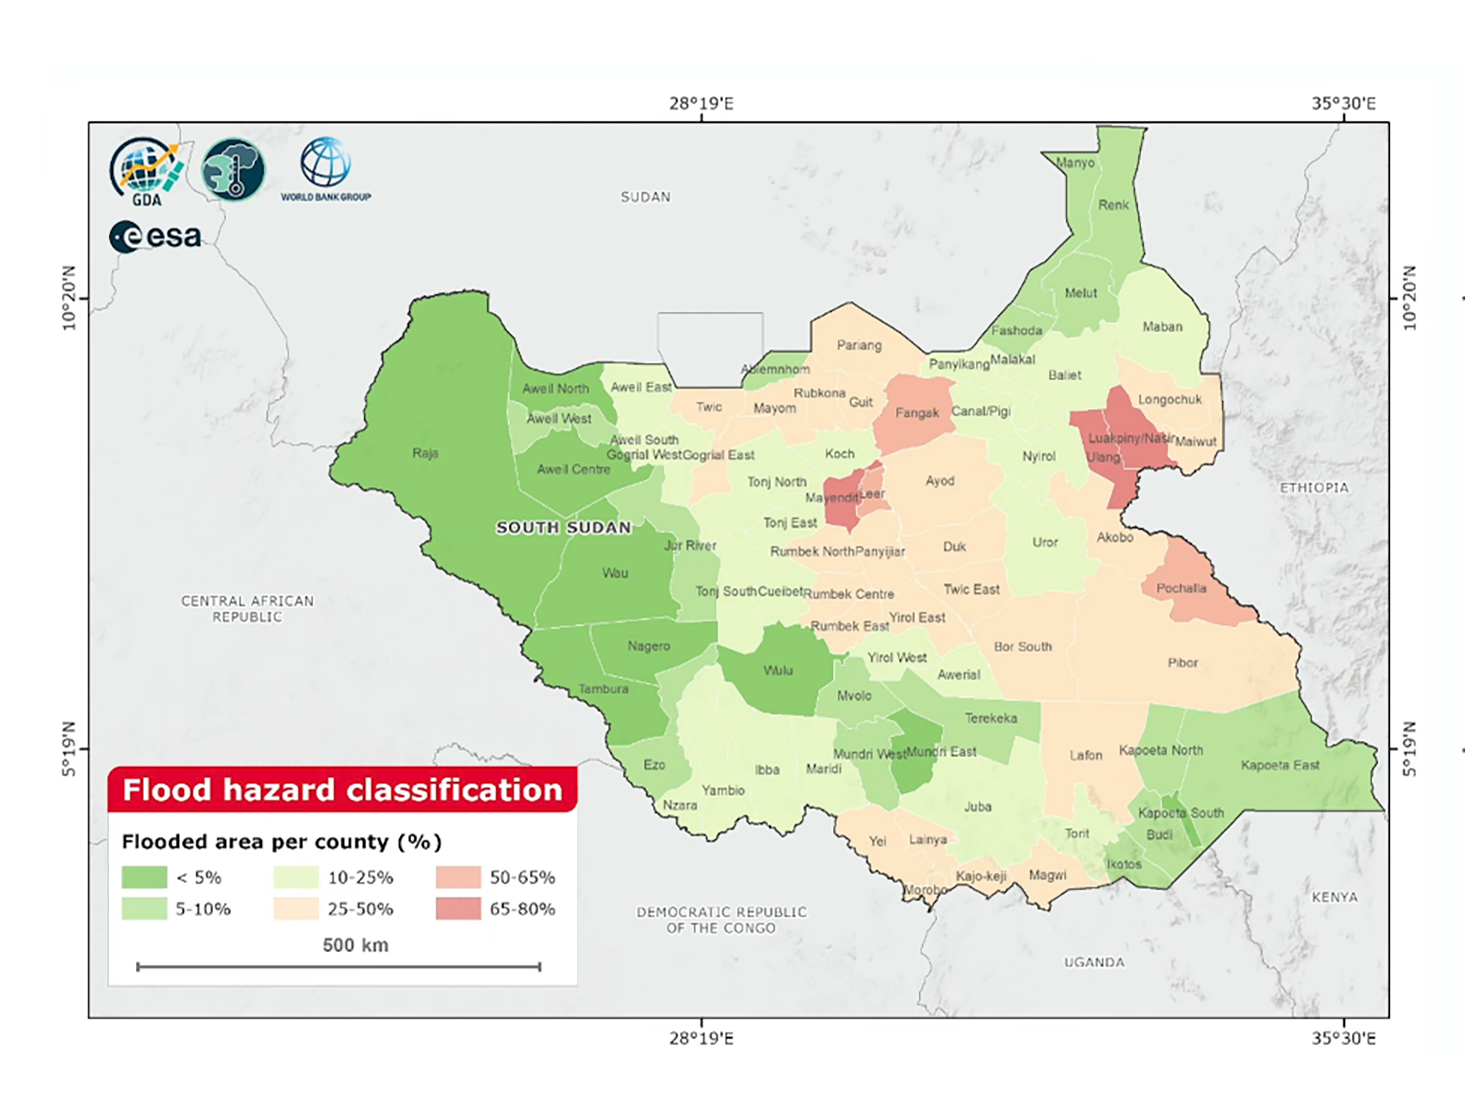
This map illustrates flood hazard levels across counties in South Sudan by showing the percentage of land affected by flooding. Areas shaded in green experience little to low flooding, while yellow and orange indicate moderate levels. Red regions represent the highest flood impact, with up to 80% of land inundated.
Source: GDA Climate Resilience
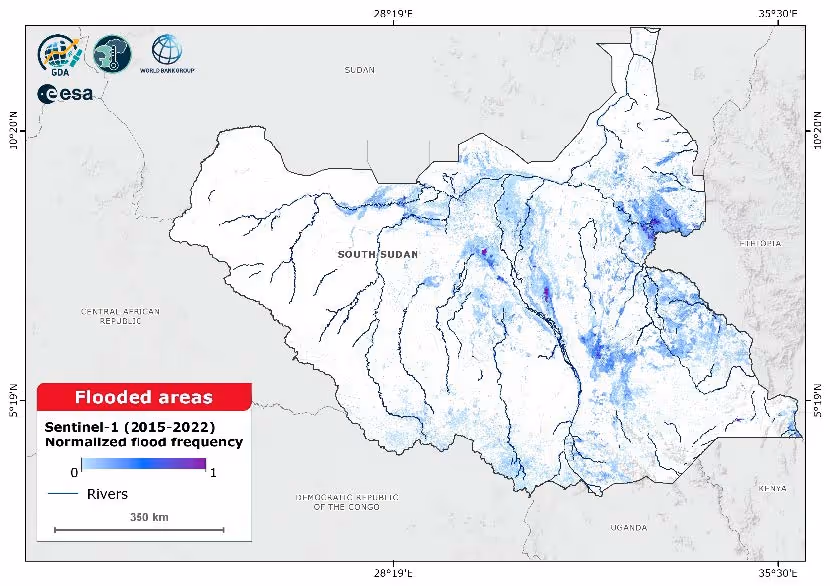
This map shows the frequency of flooding across South Sudan based on Sentinel-1 data from 2015 to 2022. The blue shading represents how often areas have been flooded, with darker shades indicating more frequent flooding. The map also highlights major river systems, showing that flooding is concentrated along rivers and low-lying regions, particularly in the central and eastern parts of the country.
Source: GDA Climate Resilience
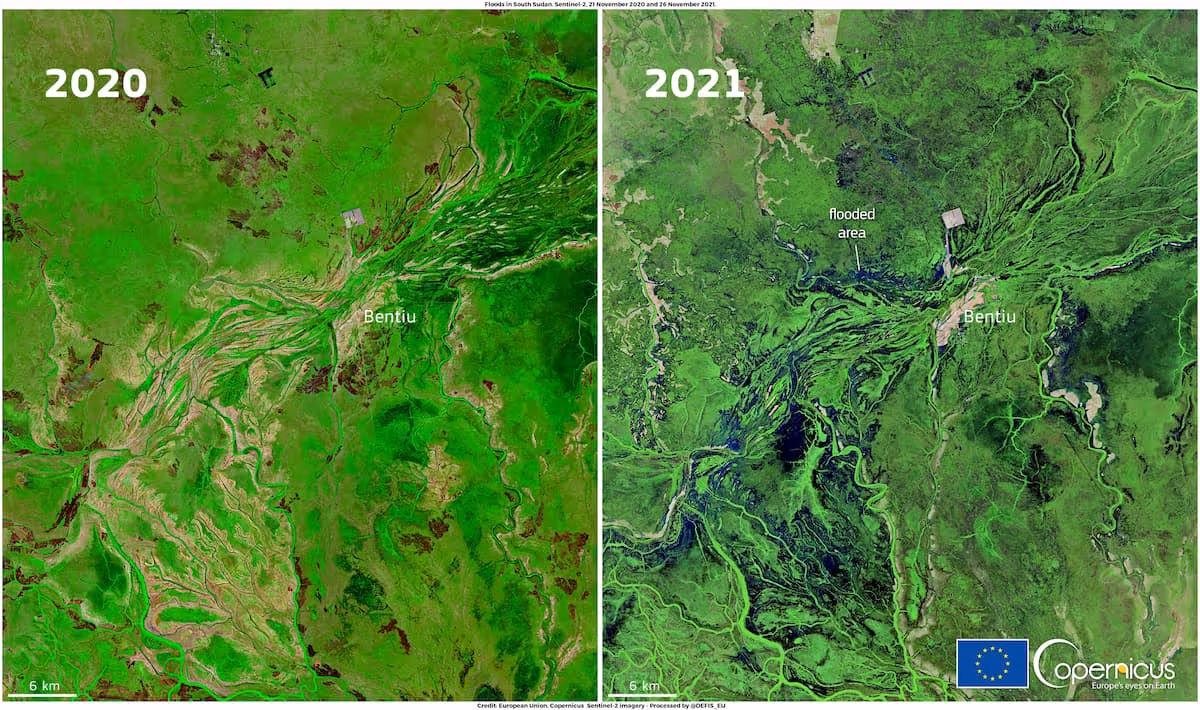
These images, acquired by Copernicus Sentinel-2 satellites on 23 November 2020 and 26 November 2021, show a flooded area near Bentiu in South Sudan.
Source: Copernicus
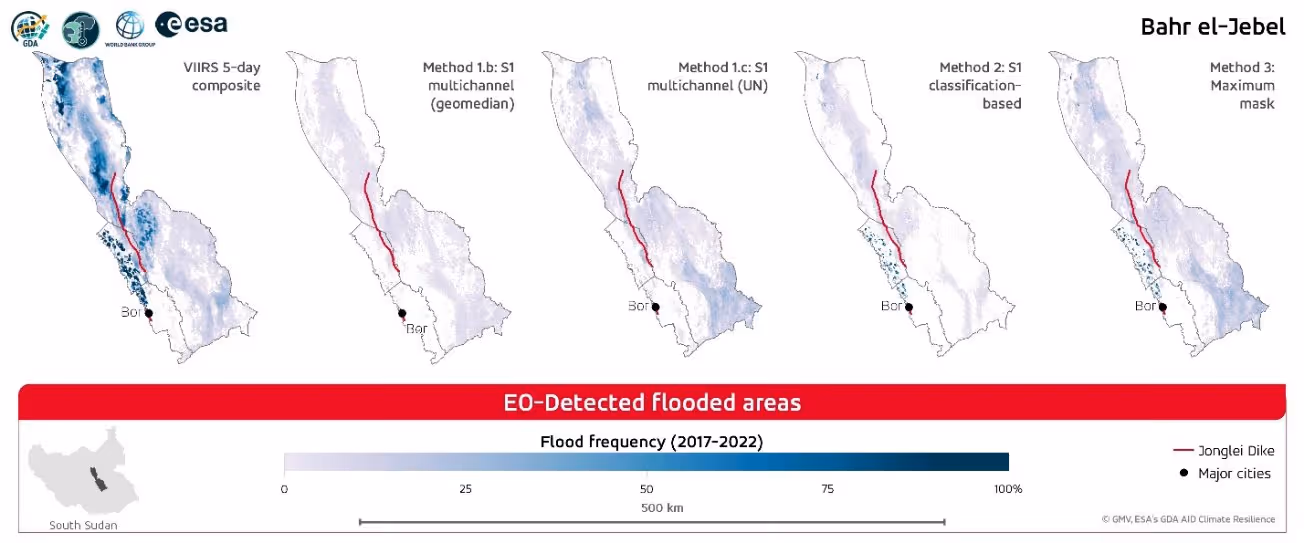
Flood frequency in the Bahr el-Jebel catchment, South Sudan (2017–2022), based on satellite-derived estimates using five different EO methods.
Source: GDA Climate Resilience

This false-colour image, captured in January 2023, highlights the widespread flooding around Bentiu. Using data from the mission’s near-infrared channel, water bodies appear in dark blue to black, while sediment-laden waters glow bright blue. Vibrant red tones along the rivers indicate healthy vegetation, providing a stark contrast to the inundated areas.
Source: contains modified Copernicus Sentinel data (2023), processed by ESA

Riverine flood risk across South Sudan, highlighting widespread high to extremely high vulnerability along major waterways. Riverine flood risk measures the percentage of the population expected to be affected by river flooding in an average year, accounting for existing flood-protection standards, and is assessed based on hazard (river overflow inundation), exposure (population in flood-prone areas), and vulnerability.
Source: GDA Climate Resilience / GDA Impact Sphere