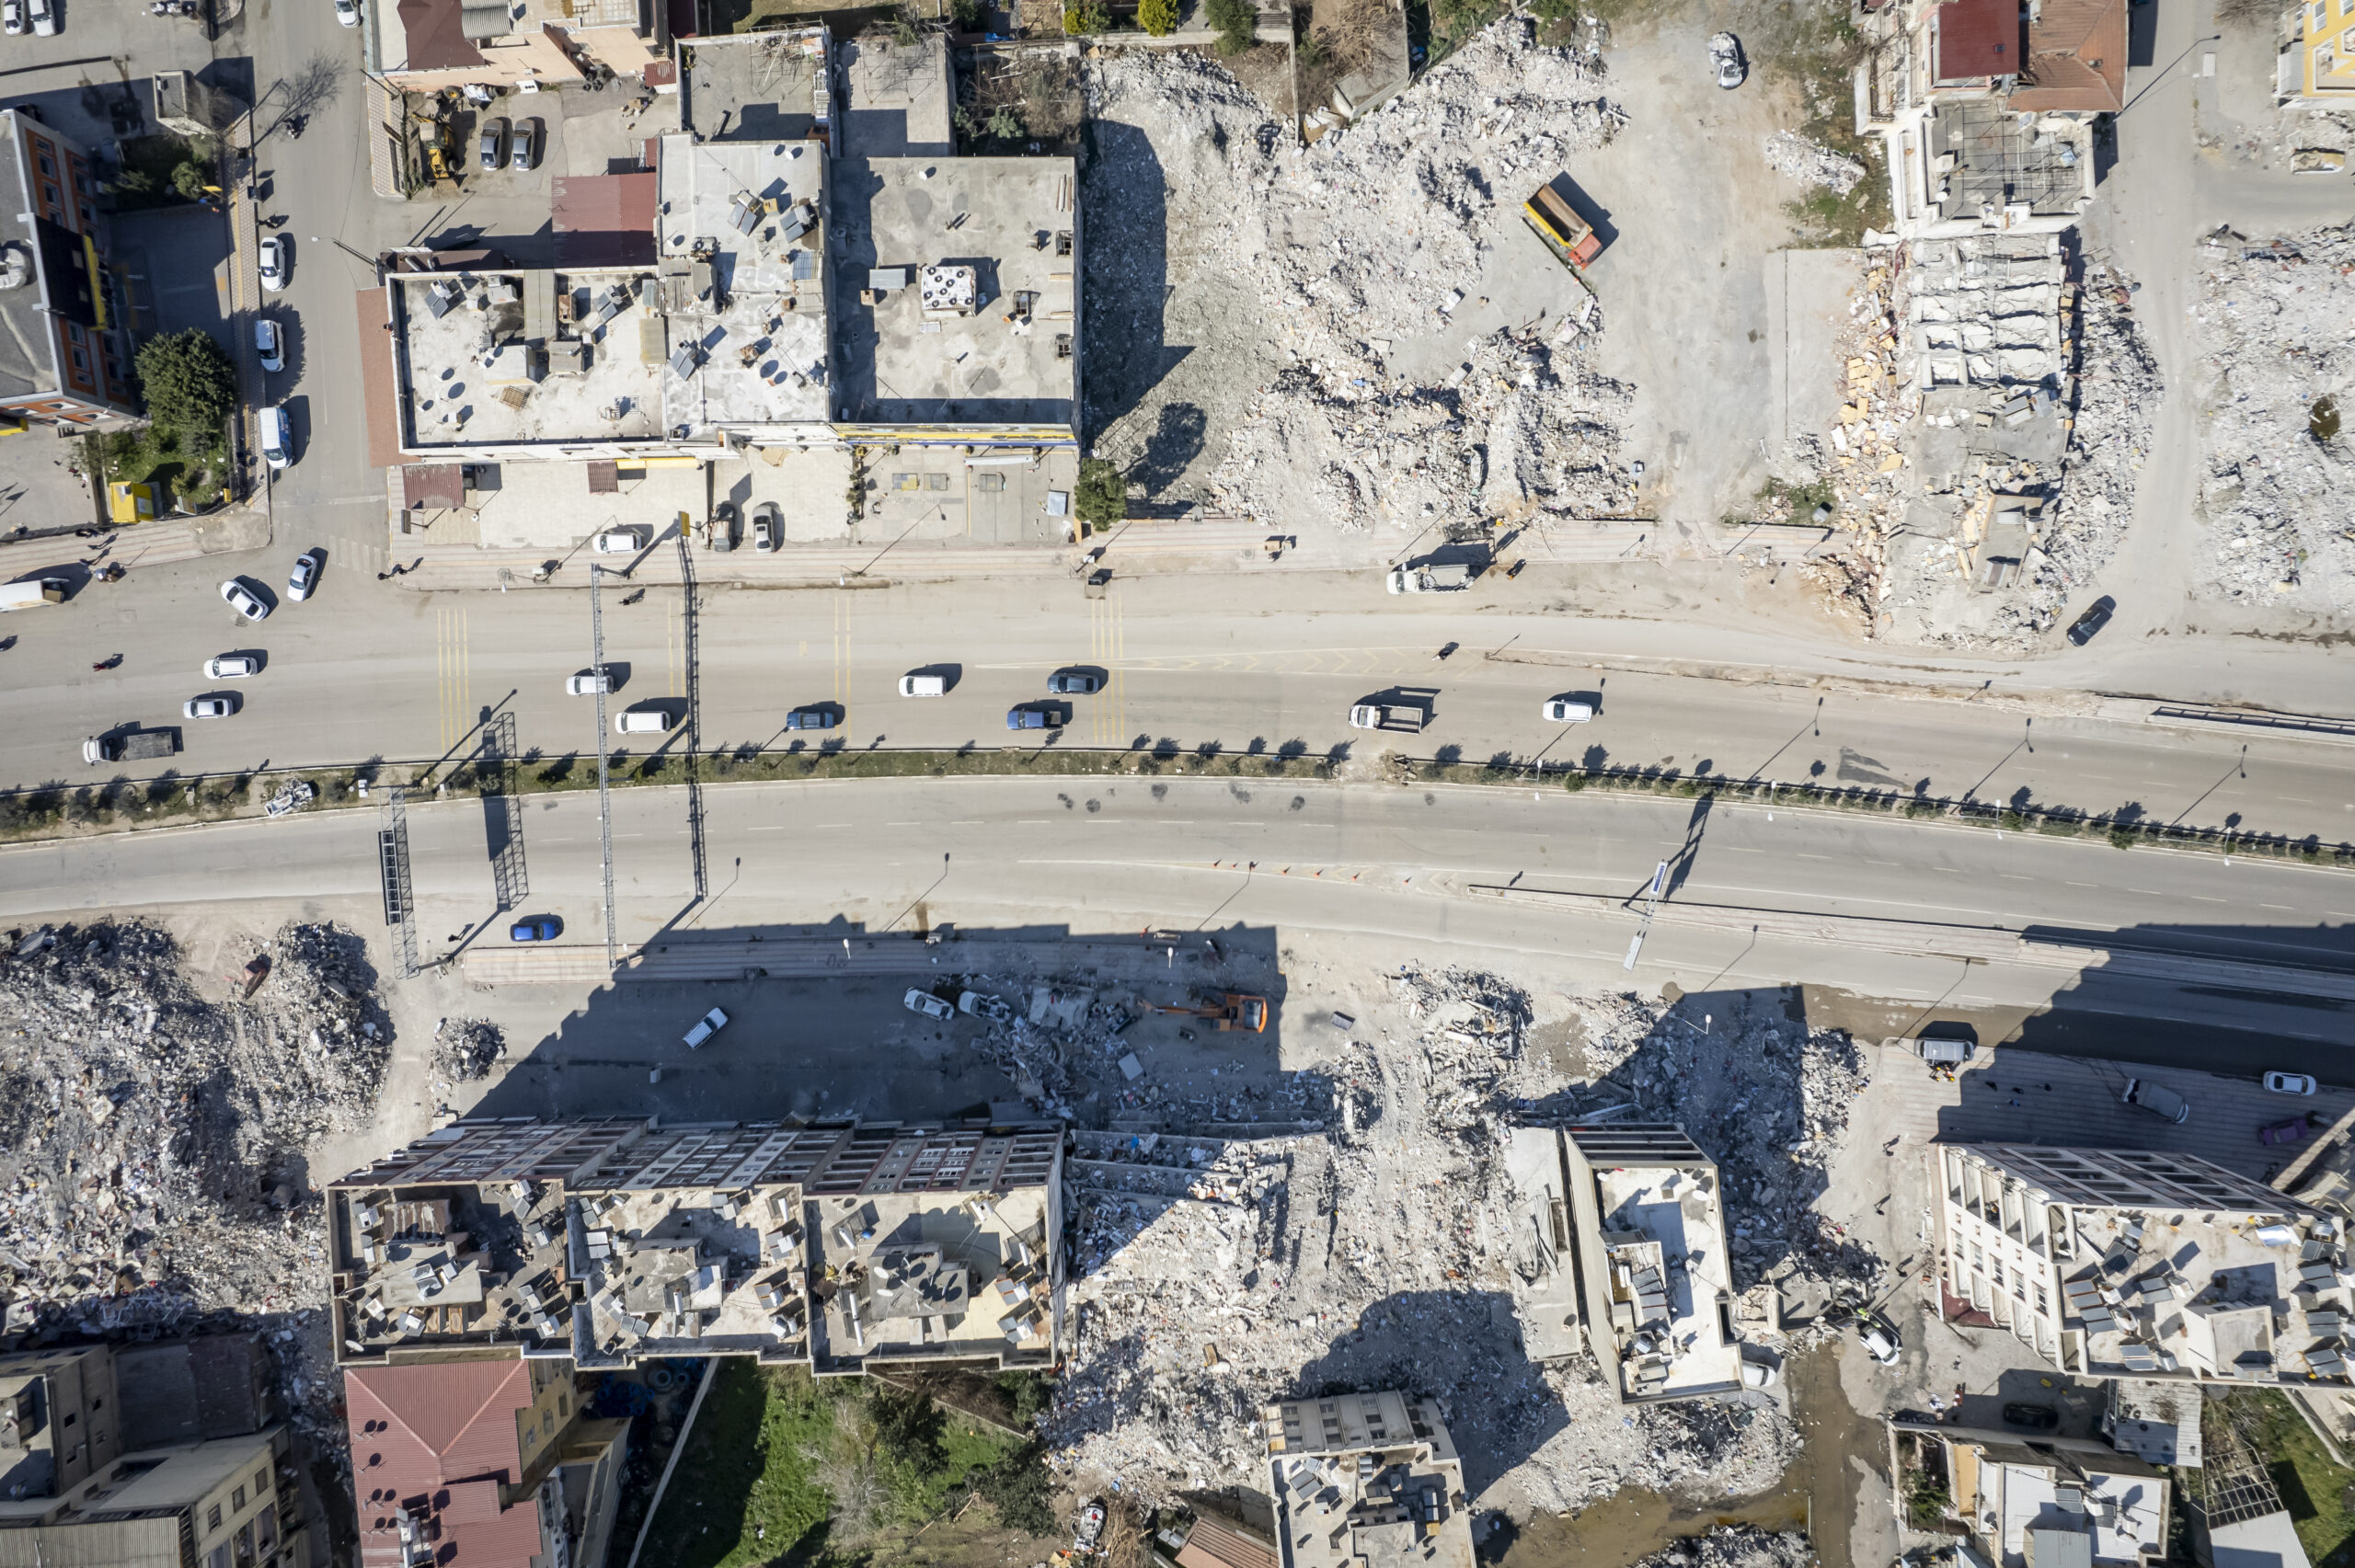
Building Classification
EO Capability Benefits
The Building Classification capability maps dominant residential building types (e.g., detached/compound housing, low- to mid-rise multi-family, high-rise residential, informal/self-built, rural/dispersed) across built-up areas. It supports exposure modelling, post-disaster impact and recovery-cost estimation, and risk-financing workflows. The capability scales from the city to the national level using mostly open datasets, A per-building classification is possible where footprints or very-high-resolution (VHR) imagery are available.
EO Capability Description
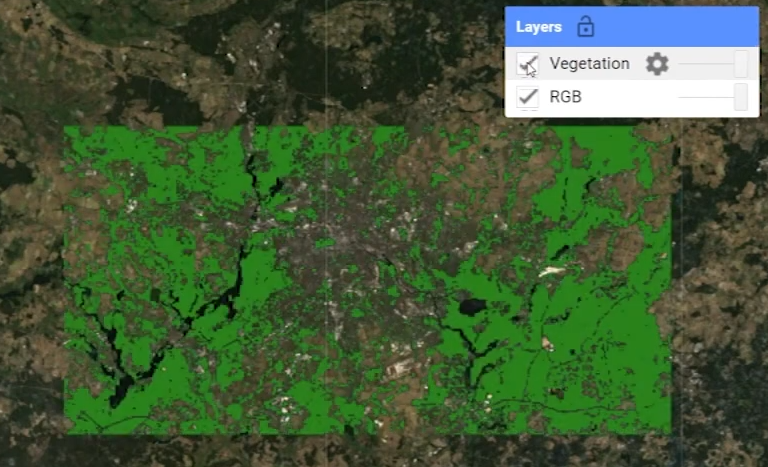
The output is a categorical raster at a spatial resolution of ~10 m assigning each settlement pixel to a building-type class. Built-up areas are delineated using DLR’s World Settlement Footprint (WSF) – a global mask of human-made structures derived from multi-sensor satellite imagery – or an equivalent Built-up Extent layer. Settlement space is partitioned into Local Neighbourhoods (LNs) using a combination of OpenStreetMap (OSM) networks and road geometries from Meta labelled “roads missing from OSM,” constrained by the built-up mask. For each LN, zonal indicators are computed including spectral statistics and vegetation indices from Sentinel-2, night-time lights, built-up height proxies (e.g., WSF-3D or equivalent), imperviousness, terrain slope, proximity to key points of interest, and shape metrics.
A hierarchical decision tree first applies simple rules (e.g., rural vs urban; informal vs formal), then a machine-learning model (e.g., Random Forest) separates pixels into more fine-grained residential types. Each built-up pixel inherits the class of its LN. Variants of this capability compute indicators per building footprint or use VHR imagery with deep learning for per-building outputs where data and VHR imagery licensing permit.